Note: The Google advertisement links below may advocate political positions that this site does not endorse.
| Map | Pie | Office | Total | D | R | I | Margin | %Margin | Dem | Rep | Ind | Oth. | Dem | Rep | Ind | Other | | | | | | | | | | | | | | | | | | |
|---|
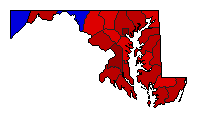
 |  | Governor |
1,111,129 |
1 |
2 |
0 |
217,035 |
19.53% |
59.76% |
40.23% |
0.00% |
0.01% |
664,015 |
446,980 |
0 |
134 |
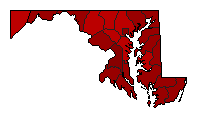
 | | Attorney General |
1,008,870 |
1 |
2 |
0 |
297,304 |
29.47% |
64.73% |
35.27% |
0.00% |
0.00% |
653,087 |
355,783 |
0 |
0 |
 | | Comptroller General |
1,067,918 |
1 |
2 |
0 |
472,571 |
44.25% |
72.12% |
27.87% |
0.00% |
0.00% |
770,232 |
297,661 |
0 |
25 |
|
