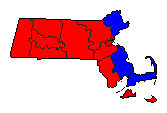
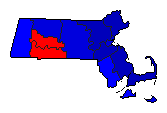
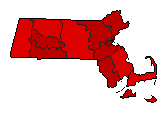
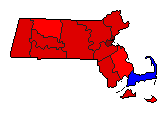
1990 General Election Results Comparison - Massachusetts
| Map | Pie | Office | Total | D | R | I | Margin | %Margin | Dem | Rep | Ind | Oth. | Dem | Rep | Ind | Other |
| Senator | 2,316,212 | 1 | 2 | 0 | 328,795 | 14.20% | 57.06% | 42.87% | 0.00% | 0.07% | 1,321,712 | 992,917 | 0 | 1,583 | ||
| Governor | 2,342,927 | 2 | 1 | 3 | 75,939 | 3.24% | 46.94% | 50.19% | 2.68% | 0.19% | 1,099,878 | 1,175,817 | 62,703 | 4,529 | ||
 | Secretary of State | 2,204,220 | 1 | 2 | 3 | 167,218 | 7.59% | 45.88% | 38.29% | 15.77% | 0.05% | 1,011,303 | 844,085 | 347,703 | 1,129 | |
 | State Treasurer | 2,268,406 | 2 | 1 | 3 | 472,713 | 20.84% | 36.40% | 57.24% | 6.32% | 0.03% | 825,808 | 1,298,521 | 143,324 | 753 | |
 | Attorney General | 2,251,540 | 1 | 2 | 0 | 633,961 | 28.16% | 64.06% | 35.90% | 0.00% | 0.03% | 1,442,359 | 808,398 | 0 | 783 | |
 | State Auditor | 2,172,100 | 1 | 2 | 3 | 386,125 | 17.78% | 54.66% | 36.88% | 8.43% | 0.03% | 1,187,241 | 801,116 | 183,136 | 607 |
Massachusetts Results for 1990
Login
© Dave Leip's Atlas of U.S. Elections, LLC 2019 All Rights Reserved
Note: The advertisement links below may advocate political positions that this site does not endorse.
Login
© Dave Leip's Atlas of U.S. Elections, LLC 2019 All Rights Reserved
Note: The advertisement links below may advocate political positions that this site does not endorse.