| Map | Pie | Office | Total | D | R | I | Margin | %Margin | Dem | Rep | Ind | Oth. | Dem | Rep | Ind | Other | | | | | | | | | | | | | | | | | | |
|---|
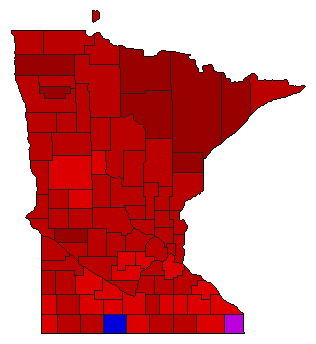
 |  | Senator |
1,808,045 |
1 |
2 |
0 |
47,624 |
2.63% |
50.44% |
47.81% |
0.00% |
1.75% |
911,999 |
864,375 |
0 |
31,671 |
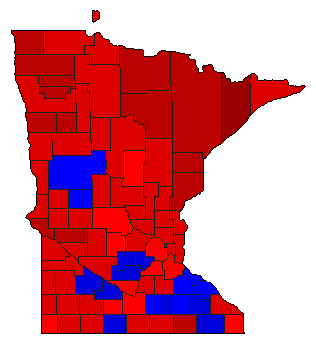
 |  | Governor |
1,788,163 |
2 |
1 |
0 |
59,770 |
3.34% |
46.76% |
50.11% |
0.00% |
3.13% |
836,218 |
895,988 |
0 |
55,957 |
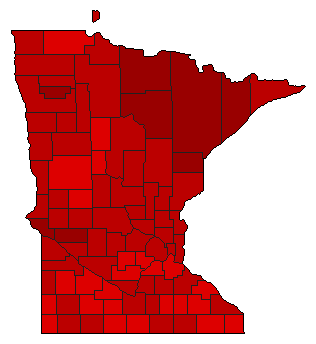
 | | Secretary of State |
1,720,897 |
1 |
2 |
0 |
468,499 |
27.22% |
63.61% |
36.39% |
0.00% |
0.00% |
1,094,698 |
626,199 |
0 |
0 |
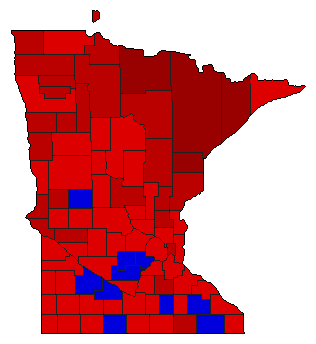
 |  | State Treasurer |
1,720,462 |
1 |
2 |
0 |
177,872 |
10.34% |
52.70% |
42.36% |
0.00% |
4.94% |
906,710 |
728,838 |
0 |
84,914 |
 |  | Attorney General |
1,781,738 |
1 |
2 |
0 |
471,156 |
26.44% |
63.22% |
36.78% |
0.00% |
0.00% |
1,126,447 |
655,291 |
0 |
0 |
 |  | State Auditor |
1,754,503 |
1 |
2 |
0 |
267,725 |
15.26% |
57.63% |
42.37% |
0.00% |
0.00% |
1,011,114 |
743,389 |
0 |
0 |
| | | Map | Pie | Initiative | Total Vote | N | | Y | Margin | %Margin | No | | Yes | Oth. | No | | Yes | |
 |  | Amendment |
1,718,011 |
2 |
0 |
1 |
1,058,199 |
61.59% |
19.20% |
0.00% |
80.80% |
0.00% |
329,906 |
0 |
1,388,105 |
0 |
|
