| Map | Pie | Office | Total | D | R | I | Margin | %Margin | Dem | Rep | Ind | Oth. | Dem | Rep | Ind | Other | | | | | | | | | | | | | | | | | | |
|---|
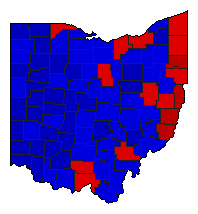
 |  | Governor |
3,477,650 |
2 |
1 |
0 |
398,687 |
11.46% |
44.27% |
55.73% |
0.00% |
0.00% |
1,539,416 |
1,938,103 |
0 |
131 |
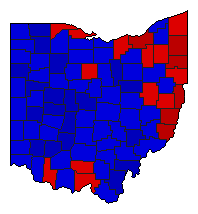
 |  | Secretary of State |
3,413,474 |
2 |
1 |
0 |
205,358 |
6.02% |
46.99% |
53.01% |
0.00% |
0.00% |
1,604,058 |
1,809,416 |
0 |
0 |
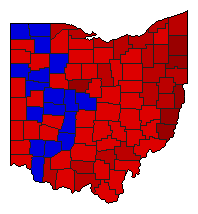 |  | State Treasurer |
3,297,888 |
1 |
2 |
0 |
624,366 |
18.93% |
59.47% |
40.53% |
0.00% |
0.00% |
1,961,127 |
1,336,761 |
0 |
0 |
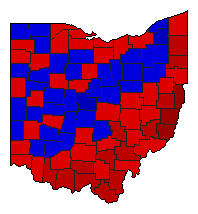
 |  | Attorney General |
3,360,162 |
1 |
2 |
0 |
1,234 |
0.04% |
50.02% |
49.98% |
0.00% |
0.00% |
1,680,698 |
1,679,464 |
0 |
0 |
 |  | State Auditor |
3,348,840 |
1 |
2 |
0 |
187,846 |
5.61% |
52.80% |
47.20% |
0.00% |
0.00% |
1,768,343 |
1,580,497 |
0 |
0 |
|
