| Map | Pie | Year | Total | D | R | I | Margin | %Margin | Dem | Rep | Ind | Oth. | Dem | Rep | Ind | Other | | | | | | | | | | | | | | | | | | |
|---|
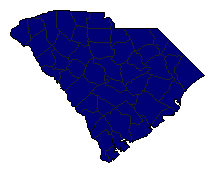
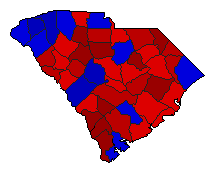
|  | 2022 |
1,252,286 |
0 |
1 |
0 |
1,207,472 |
96.42% |
0.00% |
98.21% |
0.00% |
1.79% |
0 |
1,229,879 |
0 |
22,407 |
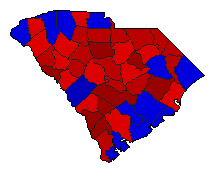
 |  | 2018 |
1,162,960 |
0 |
1 |
0 |
1,110,904 |
95.52% |
0.00% |
97.76% |
0.00% |
2.24% |
0 |
1,136,932 |
0 |
26,028 |
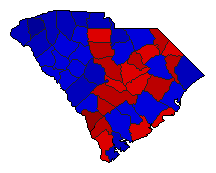
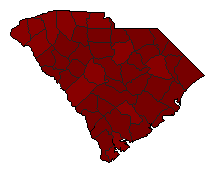
 | | 2014 |
1,218,308 |
2 |
1 |
0 |
239,483 |
19.66% |
40.14% |
59.80% |
0.00% |
0.06% |
489,066 |
728,549 |
0 |
693 |
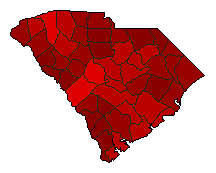
 | | 2010 |
1,321,862 |
2 |
1 |
0 |
172,539 |
13.05% |
43.45% |
56.50% |
0.00% |
0.05% |
574,302 |
746,841 |
0 |
719 |
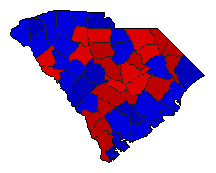 | | 2006 |
1,072,948 |
2 |
1 |
0 |
70,332 |
6.56% |
46.71% |
53.26% |
0.00% |
0.03% |
501,122 |
571,454 |
0 |
372 |
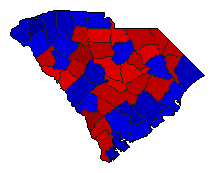 | | 2002 |
1,069,110 |
2 |
1 |
0 |
97,331 |
9.10% |
45.43% |
54.54% |
0.00% |
0.03% |
485,748 |
583,079 |
0 |
283 |
 | | 1998 |
1,029,144 |
1 |
2 |
0 |
5,539 |
0.54% |
50.25% |
49.71% |
0.00% |
0.04% |
517,126 |
511,587 |
0 |
431 |
 | | 1994 |
879,927 |
1 |
2 |
0 |
55,141 |
6.27% |
53.12% |
46.85% |
0.00% |
0.03% |
467,399 |
412,258 |
0 |
270 |
 | | 1990 |
596,705 |
1 |
0 |
0 |
476,692 |
79.89% |
89.87% |
0.00% |
0.00% |
10.13% |
536,250 |
0 |
0 |
60,455 |
 | | 1974 |
495,972 |
1 |
2 |
3 |
181,925 |
36.68% |
67.42% |
30.74% |
1.83% |
0.00% |
334,406 |
152,481 |
9,085 |
0 |
|
