| Map | Pie | Office | Total | D | R | I | Margin | %Margin | Dem | Rep | Ind | Oth. | Dem | Rep | Ind | Other | | | | | | | | | | | | | | | | | | |
|---|
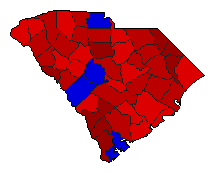
 |  | Senator |
750,729 |
2 |
1 |
0 |
237,920 |
31.69% |
32.52% |
64.21% |
0.00% |
3.27% |
244,112 |
482,032 |
0 |
24,585 |
 |  | Governor |
761,019 |
2 |
1 |
0 |
316,783 |
41.63% |
27.86% |
69.49% |
0.00% |
2.65% |
212,048 |
528,831 |
0 |
20,140 |
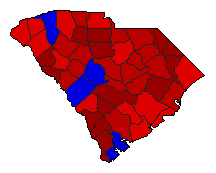
 | | Lt. Governor |
750,351 |
1 |
2 |
0 |
131,806 |
17.57% |
58.75% |
41.19% |
0.00% |
0.06% |
440,844 |
309,038 |
0 |
469 |
 | | Secretary of State |
741,353 |
2 |
1 |
0 |
51,672 |
6.97% |
46.50% |
53.47% |
0.00% |
0.04% |
344,695 |
396,367 |
0 |
291 |
 | | State Treasurer |
734,931 |
1 |
2 |
0 |
104,712 |
14.25% |
57.11% |
42.86% |
0.00% |
0.04% |
419,687 |
314,975 |
0 |
269 |
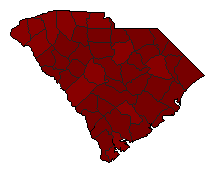 | | Comptroller General |
596,705 |
1 |
0 |
0 |
476,692 |
79.89% |
89.87% |
0.00% |
0.00% |
10.13% |
536,250 |
0 |
0 |
60,455 |
 |  | Agriculture Commissioner |
696,638 |
2 |
1 |
0 |
27,799 |
3.99% |
47.99% |
51.98% |
0.00% |
0.04% |
334,288 |
362,087 |
0 |
263 |
|
