| Map | Pie | Office | Total | D | R | I | Margin | %Margin | Dem | Rep | Ind | Oth. | Dem | Rep | Ind | Other | | | | | | | | | | | | | | | | | | |
|---|
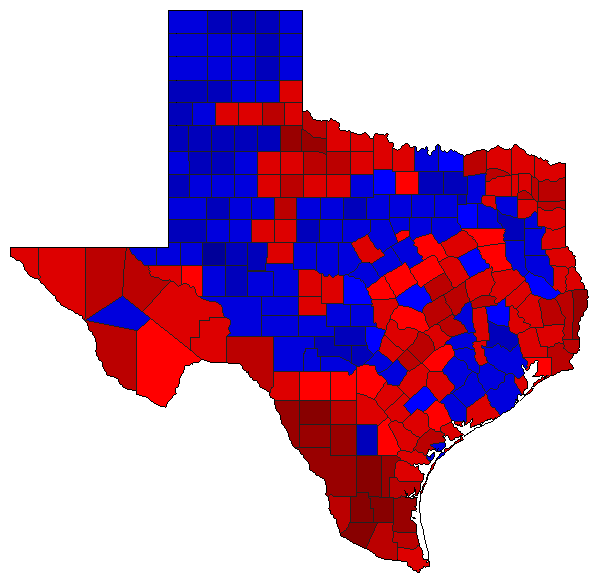
 |  | Senator |
3,822,157 |
2 |
1 |
0 |
872,371 |
22.82% |
37.41% |
60.24% |
0.00% |
2.35% |
1,429,986 |
2,302,357 |
0 |
89,814 |
 |  | Governor |
3,892,746 |
1 |
2 |
0 |
99,239 |
2.55% |
49.47% |
46.92% |
0.00% |
3.61% |
1,925,670 |
1,826,431 |
0 |
140,645 |
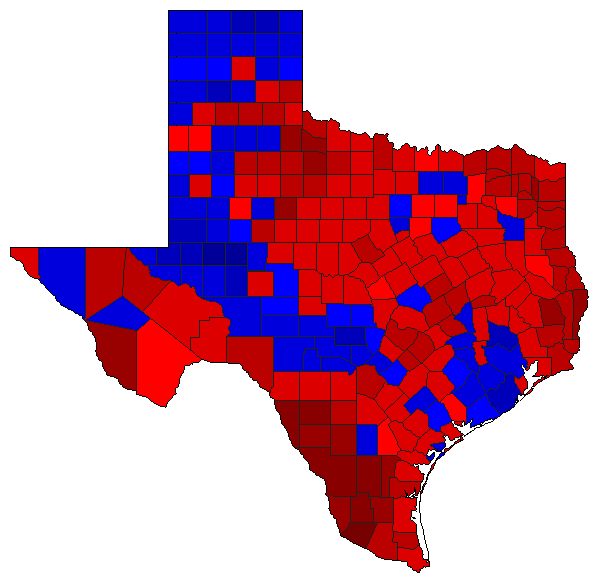
 |  | State Treasurer |
3,798,394 |
2 |
1 |
0 |
123,451 |
3.25% |
46.66% |
49.91% |
0.00% |
3.44% |
1,772,200 |
1,895,651 |
0 |
130,543 |
 |  | Attorney General |
3,782,331 |
1 |
2 |
0 |
255,608 |
6.76% |
51.92% |
45.16% |
0.00% |
2.92% |
1,963,714 |
1,708,106 |
0 |
110,511 |
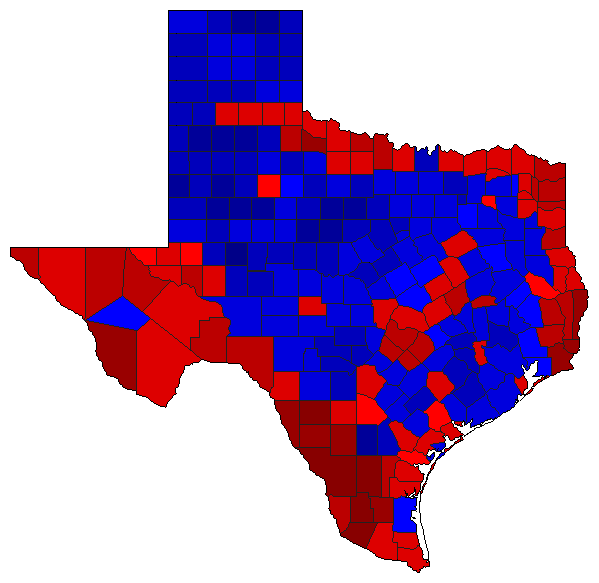
 |  | Agriculture Commissioner |
3,796,625 |
2 |
1 |
0 |
44,318 |
1.17% |
47.94% |
49.11% |
0.00% |
2.95% |
1,820,145 |
1,864,463 |
0 |
112,017 |
|