| Map | Pie | Office | Total | D | R | I | Margin | %Margin | Dem | Rep | Ind | Oth. | Dem | Rep | Ind | Other | | | | | | | | | | | | | | | | | | |
|---|
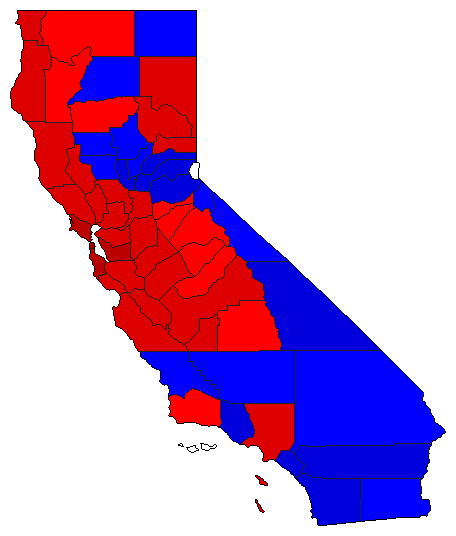
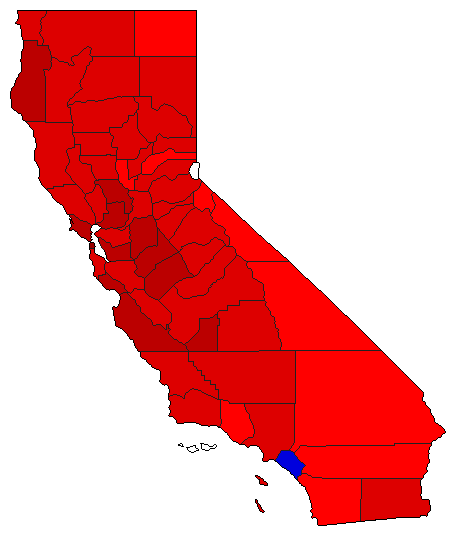
 |  | Governor |
7,699,467 |
2 |
1 |
0 |
266,707 |
3.46% |
45.78% |
49.25% |
0.00% |
4.97% |
3,525,197 |
3,791,904 |
0 |
382,366 |
 | | Lt. Governor |
7,554,300 |
1 |
2 |
0 |
687,800 |
9.10% |
51.29% |
42.18% |
0.00% |
6.53% |
3,874,308 |
3,186,508 |
0 |
493,484 |
 | | Secretary of State |
7,475,564 |
1 |
2 |
0 |
831,396 |
11.12% |
51.69% |
40.57% |
0.00% |
7.74% |
3,864,151 |
3,032,755 |
0 |
578,658 |
 | | State Treasurer |
7,352,742 |
1 |
2 |
0 |
231,775 |
3.15% |
48.68% |
45.53% |
0.00% |
5.79% |
3,579,389 |
3,347,614 |
0 |
425,739 |
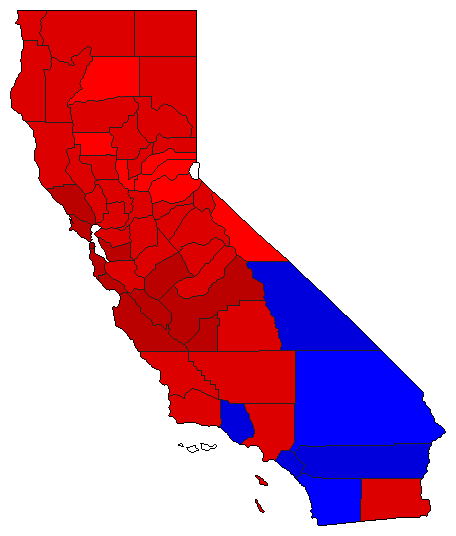
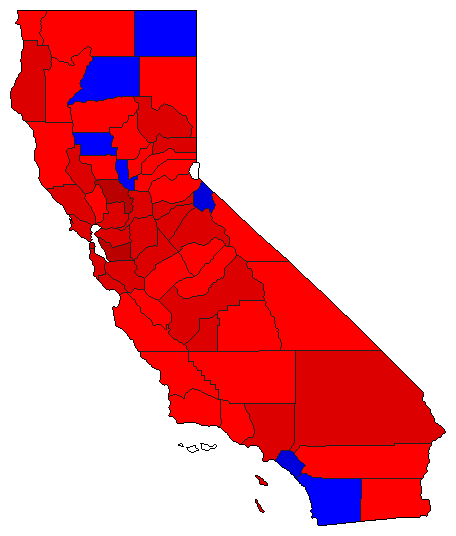
 | | Attorney General |
7,286,197 |
2 |
1 |
0 |
28,906 |
0.40% |
46.38% |
46.77% |
0.00% |
6.85% |
3,379,021 |
3,407,927 |
0 |
499,249 |
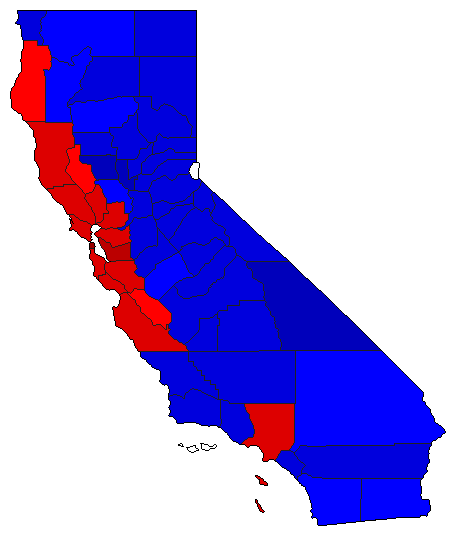
 | | Controller |
7,401,285 |
1 |
2 |
0 |
1,452,838 |
19.63% |
56.12% |
36.49% |
0.00% |
7.39% |
4,153,534 |
2,700,696 |
0 |
547,055 |
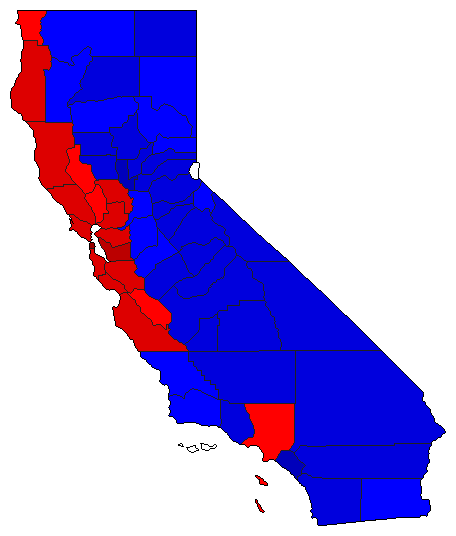
 | | Insurance Commissioner |
7,220,508 |
1 |
2 |
0 |
1,034,140 |
14.32% |
52.22% |
37.90% |
0.00% |
9.88% |
3,770,717 |
2,736,577 |
0 |
713,214 |
| | | Map | Pie | Initiative | Total Vote | N | | Y | Margin | %Margin | No | | Yes | Oth. | No | | Yes | |
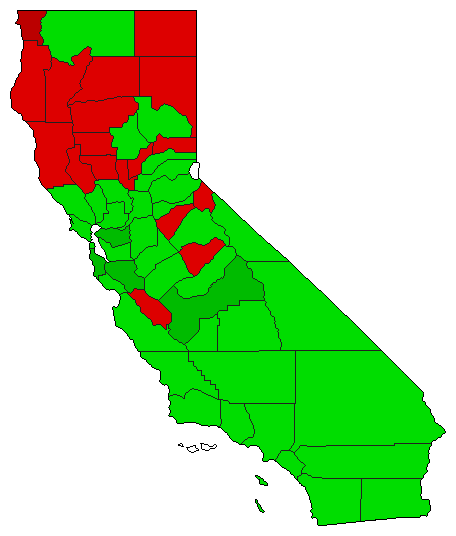
 | | Referendum |
5,091,732 |
2 |
0 |
1 |
1,967,696 |
38.64% |
30.68% |
0.00% |
69.32% |
0.00% |
1,562,018 |
0 |
3,529,714 |
0 |
 | | Referendum |
4,840,027 |
2 |
0 |
1 |
558,759 |
11.54% |
44.23% |
0.00% |
55.77% |
0.00% |
2,140,634 |
0 |
2,699,393 |
0 |
 | | Referendum |
4,816,025 |
2 |
0 |
1 |
1,546,151 |
32.10% |
33.95% |
0.00% |
66.05% |
0.00% |
1,634,937 |
0 |
3,181,088 |
0 |
 | | Referendum |
4,938,576 |
2 |
0 |
1 |
1,806,868 |
36.59% |
31.71% |
0.00% |
68.29% |
0.00% |
1,565,854 |
0 |
3,372,722 |
0 |
 | | Referendum |
4,866,887 |
2 |
0 |
1 |
1,569,857 |
32.26% |
33.87% |
0.00% |
66.13% |
0.00% |
1,648,515 |
0 |
3,218,372 |
0 |
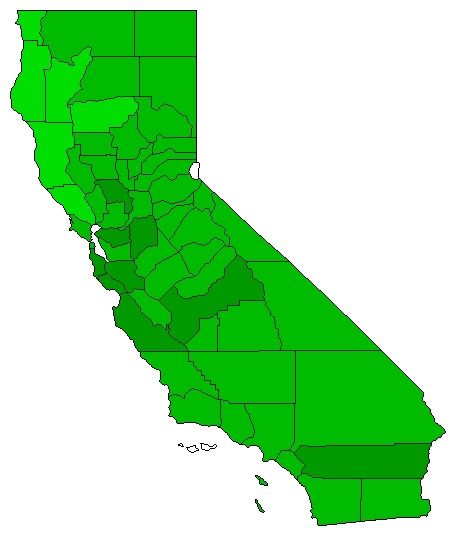
 |  | Amendment |
7,177,113 |
2 |
0 |
1 |
311,781 |
4.34% |
47.83% |
0.00% |
52.17% |
0.00% |
3,432,666 |
0 |
3,744,447 |
0 |
|
