1990 General Election Results Comparison - Colorado
| Map | Pie | Office | Total | D | R | I | Margin | %Margin | Dem | Rep | Ind | Oth. | Dem | Rep | Ind | Other |
 |  | Senator | 1,022,059 | 2 | 1 | 0 | 143,302 | 14.02% | 41.66% | 55.68% | 0.00% | 2.67% | 425,746 | 569,048 | 0 | 27,265 |
 |  | Governor | 1,011,513 | 1 | 2 | 0 | 267,629 | 26.46% | 61.89% | 35.43% | 0.00% | 2.68% | 626,032 | 358,403 | 0 | 27,078 |
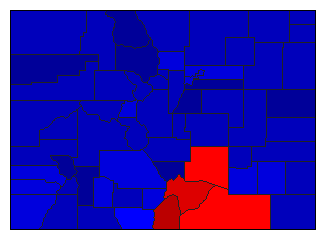 |  | Secretary of State | 985,571 | 2 | 1 | 0 | 273,421 | 27.74% | 35.03% | 62.77% | 0.00% | 2.20% | 345,245 | 618,666 | 0 | 21,660 |
 |  | State Treasurer | 995,237 | 1 | 2 | 0 | 93,085 | 9.35% | 53.74% | 44.39% | 0.00% | 1.87% | 534,877 | 441,792 | 0 | 18,568 |
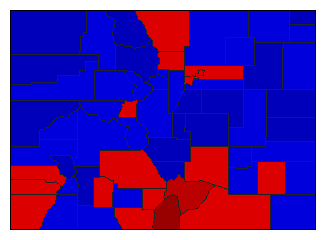 |  | Attorney General | 991,038 | 2 | 1 | 0 | 73,708 | 7.44% | 46.28% | 53.72% | 0.00% | 0.00% | 458,665 | 532,373 | 0 | 0 |
Colorado Results for 1990
Login
© Dave Leip's Atlas of U.S. Elections, LLC 2019 All Rights Reserved
Note: The advertisement links below may advocate political positions that this site does not endorse.
Login
© Dave Leip's Atlas of U.S. Elections, LLC 2019 All Rights Reserved
Note: The advertisement links below may advocate political positions that this site does not endorse.