| Map | Pie | Office | Total | D | R | I | Margin | %Margin | Dem | Rep | Ind | Oth. | Dem | Rep | Ind | Other | | | | | | | | | | | | | | | | | | |
|---|
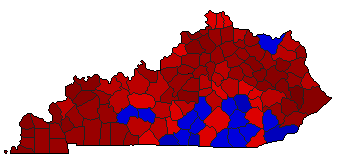
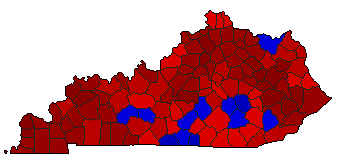
 |  | Governor |
834,920 |
1 |
2 |
0 |
246,016 |
29.47% |
64.73% |
35.27% |
0.00% |
0.00% |
540,468 |
294,452 |
0 |
0 |
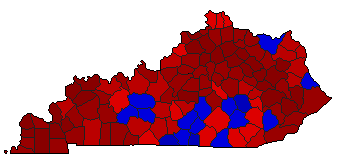
 | | Lt. Governor |
764,880 |
1 |
2 |
0 |
263,166 |
34.41% |
67.20% |
32.80% |
0.00% |
0.00% |
514,023 |
250,857 |
0 |
0 |
 | | Secretary of State |
718,125 |
1 |
2 |
0 |
266,113 |
37.06% |
68.53% |
31.47% |
0.00% |
0.00% |
492,119 |
226,006 |
0 |
0 |
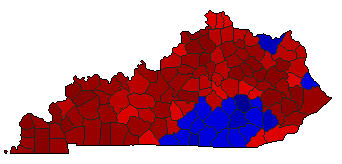
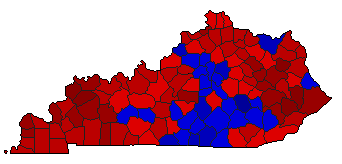 | | State Treasurer |
718,426 |
1 |
2 |
0 |
95,912 |
13.35% |
56.68% |
43.32% |
0.00% |
0.00% |
407,169 |
311,257 |
0 |
0 |
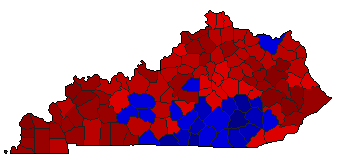 | | Attorney General |
731,150 |
1 |
2 |
0 |
170,036 |
23.26% |
61.63% |
38.37% |
0.00% |
0.00% |
450,593 |
280,557 |
0 |
0 |
 | | State Auditor |
717,092 |
1 |
2 |
0 |
213,146 |
29.72% |
64.86% |
35.14% |
0.00% |
0.00% |
465,119 |
251,973 |
0 |
0 |
 |  | Agriculture Commissioner |
697,806 |
1 |
2 |
0 |
233,144 |
33.41% |
66.71% |
33.29% |
0.00% |
0.00% |
465,475 |
232,331 |
0 |
0 |
|
