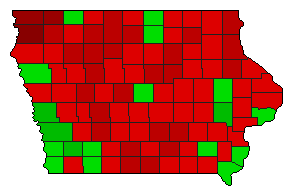
1992 General Election Results Comparison - Iowa
| Map | Pie | Office | Total | D | R | I | Margin | %Margin | Dem | Rep | Ind | Oth. | Dem | Rep | Ind | Other |
 |  | President | 1,354,607 | 1 | 2 | 3 | 81,462 | 6.01% | 43.29% | 37.27% | 18.71% | 0.73% | 586,353 | 504,891 | 253,468 | 9,895 |
 |  | Senator | 1,292,494 | 2 | 1 | 5 | 548,200 | 42.41% | 27.20% | 69.61% | 0.43% | 2.76% | 351,561 | 899,761 | 5,508 | 35,664 |
| Map | Pie | Initiative | Total Vote | N | Y | Margin | %Margin | No | Yes | Oth. | No | Yes | ||||
 |  | Amendment | 1,162,757 | 1 | 0 | 2 | 46,921 | 4.04% | 52.02% | 0.00% | 47.98% | 0.00% | 604,839 | 0 | 557,918 | 0 |
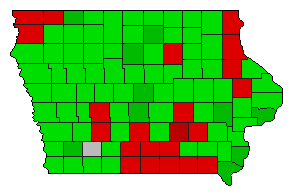 |  | Amendment | 942,684 | 2 | 0 | 1 | 137,956 | 14.63% | 42.68% | 0.00% | 57.32% | 0.00% | 402,364 | 0 | 540,320 | 0 |
Iowa Results for 1992
Login
© Dave Leip's Atlas of U.S. Elections, LLC 2019 All Rights Reserved
Note: The advertisement links below may advocate political positions that this site does not endorse.
Login
© Dave Leip's Atlas of U.S. Elections, LLC 2019 All Rights Reserved
Note: The advertisement links below may advocate political positions that this site does not endorse.