| Map | Pie | Office | Total | D | R | I | Margin | %Margin | Dem | Rep | Ind | Oth. | Dem | Rep | Ind | Other | | | | | | | | | | | | | | | | | | |
|---|
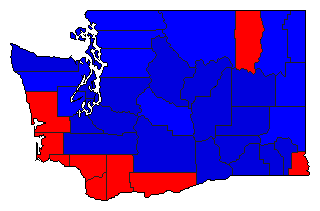
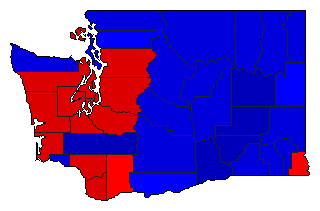
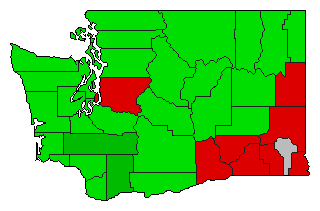
 |  | President |
2,288,230 |
1 |
2 |
3 |
261,803 |
11.44% |
43.40% |
31.96% |
23.68% |
0.97% |
993,037 |
731,234 |
541,780 |
22,179 |
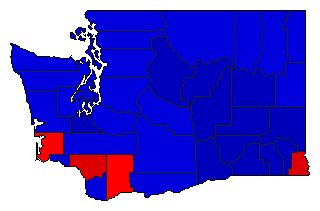
 |  | Senator |
2,218,802 |
1 |
2 |
0 |
177,144 |
7.98% |
53.99% |
46.01% |
0.00% |
0.00% |
1,197,973 |
1,020,829 |
0 |
0 |
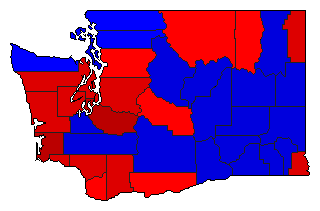
 |  | Governor |
2,270,531 |
1 |
2 |
0 |
98,099 |
4.32% |
52.16% |
47.84% |
0.00% |
0.00% |
1,184,315 |
1,086,216 |
0 |
0 |
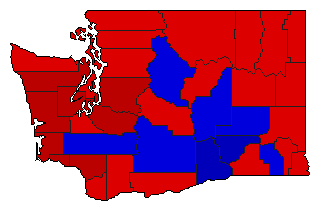
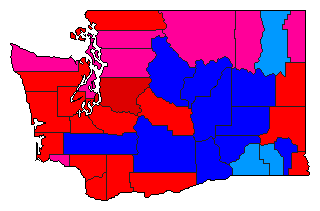
 | | Lt. Governor |
2,158,985 |
2 |
1 |
0 |
210,905 |
9.77% |
39.93% |
49.70% |
0.00% |
10.37% |
862,063 |
1,072,968 |
0 |
223,954 |
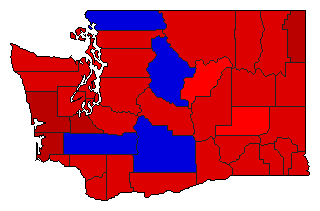
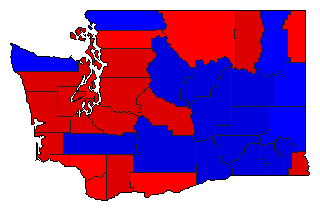
 | | Secretary of State |
2,149,020 |
2 |
1 |
0 |
330,761 |
15.39% |
40.75% |
56.14% |
0.00% |
3.12% |
875,653 |
1,206,414 |
0 |
66,953 |
 | | State Treasurer |
2,093,198 |
1 |
2 |
0 |
381,856 |
18.24% |
59.12% |
40.88% |
0.00% |
0.00% |
1,237,527 |
855,671 |
0 |
0 |
 | | Attorney General |
2,169,854 |
1 |
2 |
0 |
243,838 |
11.24% |
54.88% |
43.64% |
0.00% |
1.48% |
1,190,784 |
946,946 |
0 |
32,124 |
 | | Comptroller General |
2,140,797 |
1 |
2 |
0 |
161,930 |
7.56% |
51.96% |
44.40% |
0.00% |
3.64% |
1,112,389 |
950,459 |
0 |
77,949 |
 | | State Auditor |
2,081,668 |
1 |
2 |
0 |
95,608 |
4.59% |
50.07% |
45.47% |
0.00% |
4.46% |
1,042,229 |
946,621 |
0 |
92,818 |
 | | Controller |
2,287,565 |
1 |
2 |
3 |
261,803 |
11.44% |
43.41% |
31.97% |
23.68% |
0.94% |
993,037 |
731,234 |
541,780 |
21,514 |
 | | Insurance Commissioner |
2,092,062 |
1 |
2 |
0 |
154,680 |
7.39% |
50.15% |
42.76% |
0.00% |
7.09% |
1,049,231 |
894,551 |
0 |
148,280 |
| | | Map | Pie | Initiative | Total Vote | N | | Y | Margin | %Margin | No | | Yes | Oth. | No | | Yes | |
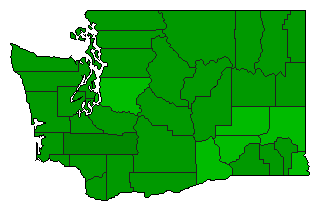
 | | Initiative |
2,138,245 |
2 |
0 |
1 |
101,725 |
4.76% |
47.62% |
0.00% |
52.38% |
0.00% |
1,018,260 |
0 |
1,119,985 |
0 |
 | | Initiative |
2,125,458 |
2 |
0 |
1 |
973,136 |
45.78% |
27.11% |
0.00% |
72.89% |
0.00% |
576,161 |
0 |
1,549,297 |
0 |
|
