| Map | Pie | Office | Total | D | R | I | Margin | %Margin | Dem | Rep | Ind | Oth. | Dem | Rep | Ind | Other | | | | | | | | | | | | | | | | | | |
|---|
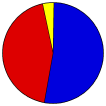
|  | 2020 | 306 | 232 | 0 |
158,594,895 |
1 |
2 |
10 |
7,060,528 |
4.45% |
51.25% |
46.80% |
0.03% |
1.91% |
81,286,454 |
74,225,926 |
49,812 |
3,032,703 |
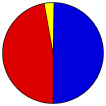
|  | 2016 | 227 | 304 | 7 |
137,143,218 |
1 |
2 |
6 |
2,868,524 |
2.09% |
48.02% |
45.93% |
0.53% |
5.52% |
65,853,677 |
62,985,153 |
732,409 |
7,571,979 |
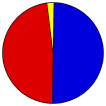
|  | 2012 | 332 | 206 | 0 |
129,237,642 |
1 |
2 |
- |
4,984,100 |
3.86% |
51.01% |
47.15% |
0.00% |
1.85% |
65,918,507 |
60,934,407 |
0 |
2,384,728 |
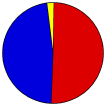
|  | 2008 | 365 | 173 | 0 |
131,473,705 |
1 |
2 |
- |
9,549,105 |
7.26% |
52.86% |
45.60% |
0.00% |
1.54% |
69,499,428 |
59,950,323 |
0 |
2,023,954 |
|  | 2004 | 251 | 286 | 1 |
122,303,590 |
2 |
1 |
- |
3,012,457 |
2.46% |
48.26% |
50.73% |
0.00% |
1.01% |
59,027,115 |
62,039,572 |
0 |
1,236,903 |
|  | 2003 | | | 0 |
0 |
0 |
0 |
- | 0 | 0.00% |
0% |
0% |
0% |
0% |
0 |
0 |
0 |
0 |
|  | 2002 | | | 0 |
3,578,660 |
1 |
2 |
- |
187,482 |
5.24% |
778.11% |
865.88% |
0.00% |
-1,543.99% |
27,845,801 |
30,986,936 |
0 |
-55,254,077 |
|  | 2000 | 266 | 271 | 1 |
105,425,985 |
1 |
2 |
3 |
547,398 |
0.52% |
48.38% |
47.87% |
2.74% |
1.02% |
51,009,810 |
50,462,412 |
2,883,443 |
1,070,320 |
|  | 1999 | | | 0 |
2,632,601 |
2 |
1 |
- |
191,105 |
7.26% |
42.30% |
49.56% |
0.00% |
8.14% |
1,113,577 |
1,304,682 |
0 |
214,342 |
|  | 1998 | | | 0 |
0 |
0 |
0 |
- | 0 | 0.00% |
0% |
0% |
0% |
0% |
0 |
0 |
0 |
0 |
|  | 1996 | 379 | 159 | 0 |
96,275,640 |
1 |
2 |
3 |
8,201,370 |
8.52% |
49.23% |
40.72% |
8.40% |
1.65% |
47,400,125 |
39,198,755 |
8,085,402 |
1,591,358 |
|  | 1994 | | | 0 |
0 |
0 |
0 |
0 | 0 | 0.00% |
0% |
0% |
0% |
0% |
0 |
0 |
0 |
0 |
|  | 1992 | 370 | 168 | 0 |
104,426,611 |
1 |
2 |
3 |
5,805,256 |
5.56% |
43.01% |
37.45% |
18.91% |
0.64% |
44,909,806 |
39,104,550 |
19,743,821 |
668,434 |
|  | 1990 | | | 0 |
597 |
0 |
0 |
- | 597 | 100.00% |
257,130.32% |
334,205.36% |
0.00% |
-591,235.68% |
1,535,068 |
1,995,206 |
0 |
-3,529,677 |
|