| Map | Pie | Office | Total | D | R | I | Margin | %Margin | Dem | Rep | Ind | Oth. | Dem | Rep | Ind | Other | | | | | | | | | | | | | | | | | | |
|---|
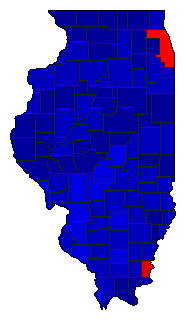
 |  | Governor |
3,106,566 |
2 |
1 |
0 |
914,468 |
29.44% |
34.44% |
63.87% |
0.00% |
1.69% |
1,069,850 |
1,984,318 |
0 |
52,398 |
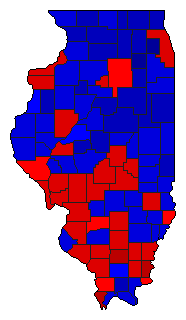
 | | Secretary of State |
3,088,847 |
2 |
1 |
3 |
685,515 |
22.19% |
38.29% |
60.48% |
1.23% |
0.00% |
1,182,629 |
1,868,144 |
38,074 |
0 |
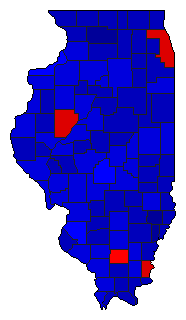
 | | State Treasurer |
2,984,760 |
2 |
1 |
0 |
77,018 |
2.58% |
47.82% |
50.40% |
0.00% |
1.78% |
1,427,317 |
1,504,335 |
0 |
53,108 |
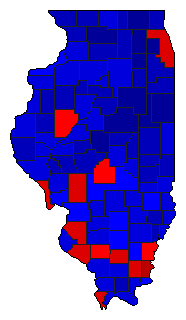
 | | Attorney General |
3,080,375 |
2 |
1 |
0 |
280,681 |
9.11% |
44.52% |
53.63% |
0.00% |
1.85% |
1,371,295 |
1,651,976 |
0 |
57,104 |
 | | Comptroller General |
2,936,321 |
2 |
1 |
0 |
406,994 |
13.86% |
41.14% |
55.00% |
0.00% |
3.85% |
1,208,128 |
1,615,122 |
0 |
113,071 |
|
