| Map | Pie | Office | Total | D | R | I | Margin | %Margin | Dem | Rep | Ind | Oth. | Dem | Rep | Ind | Other | | | | | | | | | | | | | | | | | | |
|---|
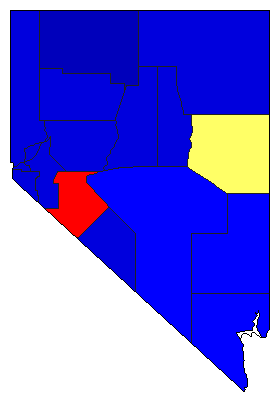
 |  | Senator |
380,530 |
1 |
2 |
4 |
37,784 |
9.93% |
50.93% |
41.00% |
1.75% |
6.32% |
193,804 |
156,020 |
6,666 |
24,040 |
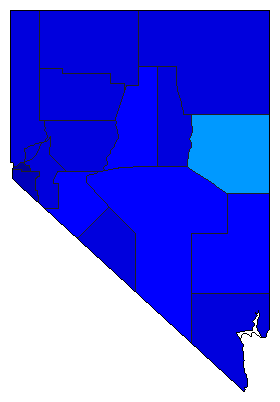
 |  | Governor |
379,676 |
1 |
2 |
0 |
43,151 |
11.37% |
52.68% |
41.32% |
0.00% |
6.00% |
200,026 |
156,875 |
0 |
22,775 |
 |  | Lt. Governor |
379,052 |
2 |
1 |
3 |
34,840 |
9.19% |
40.72% |
49.91% |
4.18% |
5.19% |
154,347 |
189,187 |
15,827 |
19,691 |
 |  | Secretary of State |
373,872 |
2 |
1 |
3 |
90,620 |
24.24% |
30.34% |
54.58% |
8.33% |
6.76% |
113,421 |
204,041 |
31,131 |
25,279 |
 |  | State Treasurer |
371,506 |
2 |
1 |
3 |
157,131 |
42.30% |
20.52% |
62.81% |
7.73% |
8.94% |
76,221 |
233,352 |
28,720 |
33,213 |
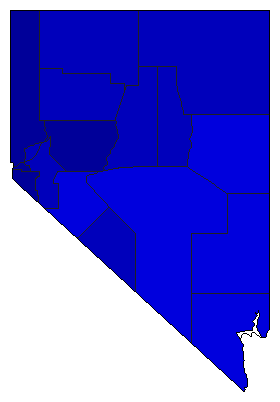
 |  | Attorney General |
379,048 |
1 |
2 |
3 |
56,058 |
14.79% |
53.02% |
38.23% |
5.91% |
2.83% |
200,983 |
144,925 |
22,402 |
10,738 |
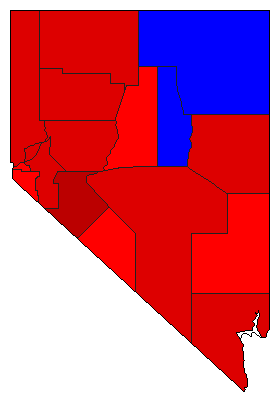
 |  | Controller |
374,687 |
2 |
1 |
4 |
5,647 |
1.51% |
44.17% |
45.68% |
3.59% |
6.56% |
165,515 |
171,162 |
13,440 |
24,570 |
|
