| Map | Pie | Year | Total | D | R | I | Margin | %Margin | Dem | Rep | Ind | Oth. | Dem | Rep | Ind | Other | | | | | | | | | | | | | | | | | | |
|---|
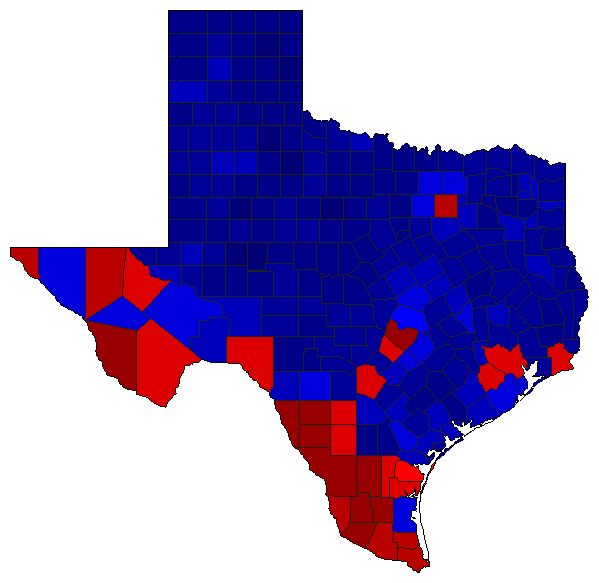
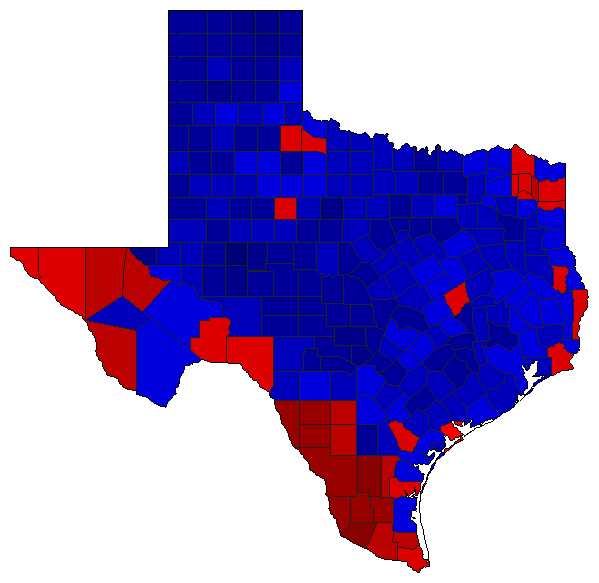
|  | 2022 |
7,953,789 |
2 |
1 |
0 |
1,006,583 |
12.66% |
43.67% |
56.33% |
0.00% |
0.00% |
3,473,603 |
4,480,186 |
0 |
0 |
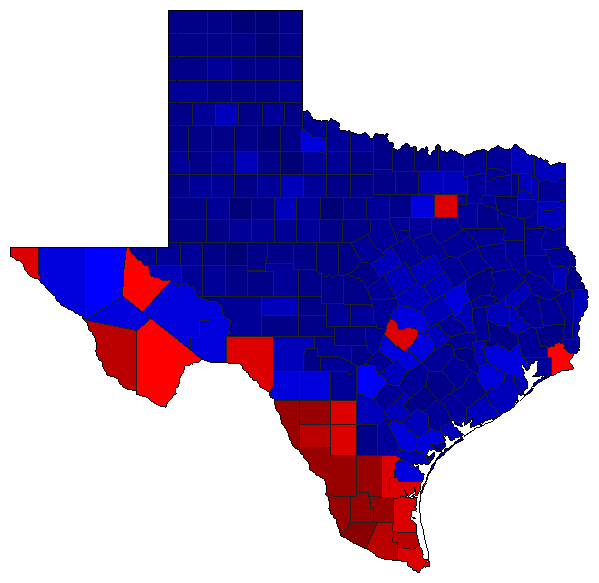
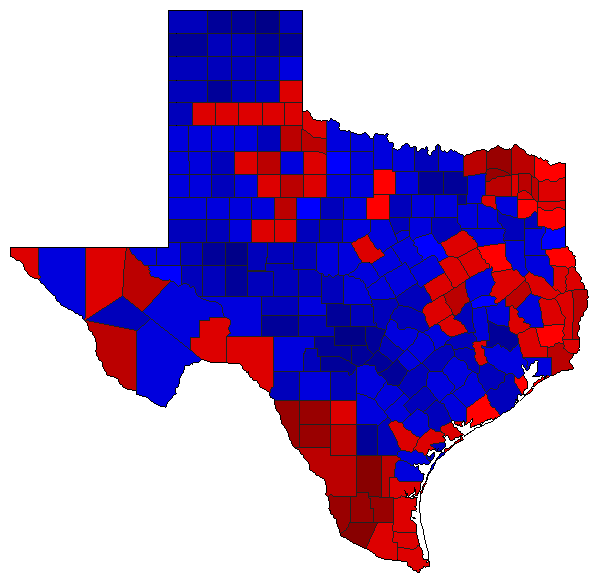
 |  | 2018 |
8,235,303 |
2 |
1 |
0 |
399,390 |
4.85% |
46.41% |
51.26% |
0.00% |
2.33% |
3,822,137 |
4,221,527 |
0 |
191,639 |
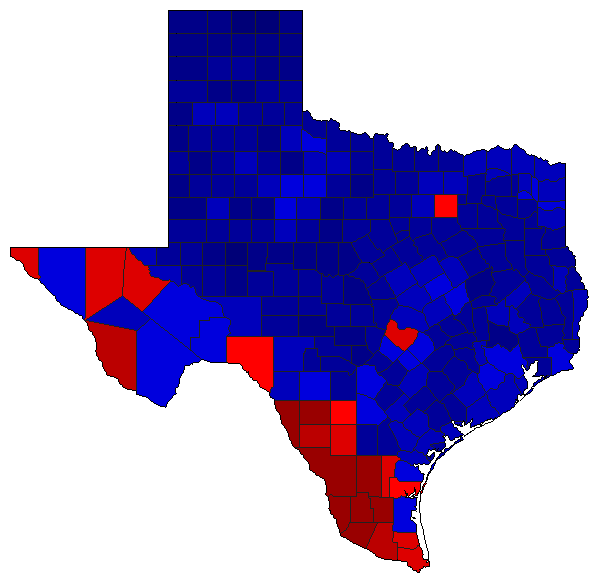
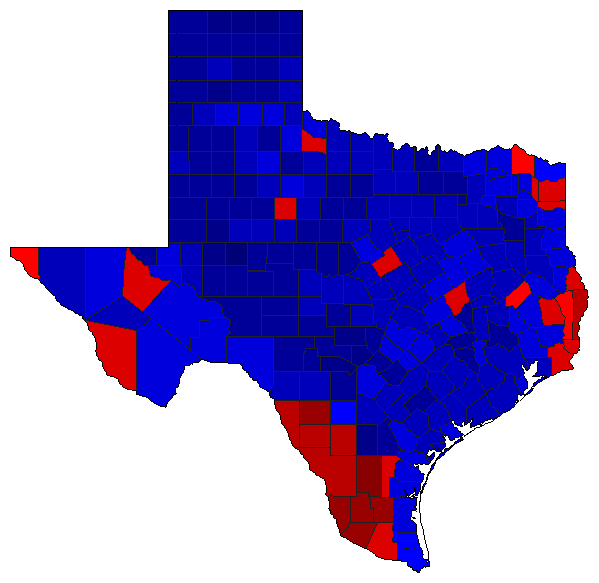
 |  | 2014 |
4,605,836 |
2 |
1 |
0 |
1,001,611 |
21.75% |
36.85% |
58.59% |
0.00% |
4.56% |
1,697,083 |
2,698,694 |
0 |
210,059 |
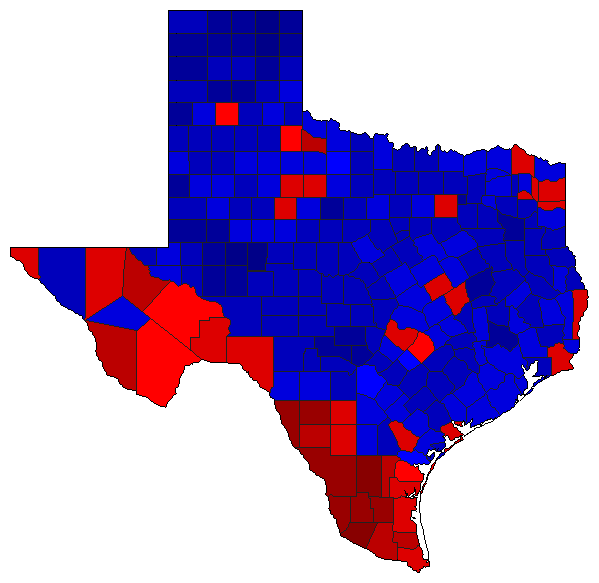
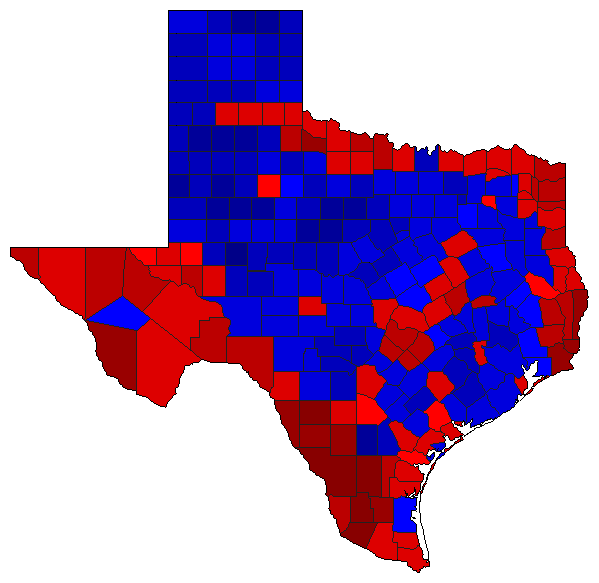
 | | 2010 |
4,856,266 |
2 |
1 |
0 |
1,215,319 |
25.03% |
35.80% |
60.82% |
0.00% |
3.38% |
1,738,456 |
2,953,775 |
0 |
164,035 |
 | | 2006 |
4,212,797 |
2 |
1 |
3 |
547,004 |
12.98% |
41.79% |
54.77% |
3.44% |
0.00% |
1,760,402 |
2,307,406 |
144,989 |
0 |
 | | 2002 |
4,427,553 |
2 |
1 |
4 |
961,757 |
21.72% |
37.82% |
59.54% |
1.18% |
1.46% |
1,674,372 |
2,636,129 |
52,234 |
64,818 |
 | | 1998 |
3,590,727 |
2 |
1 |
3 |
510,340 |
14.21% |
42.08% |
56.29% |
1.52% |
0.10% |
1,511,045 |
2,021,385 |
54,669 |
3,628 |
 | | 1994 |
4,111,815 |
2 |
1 |
3 |
1,066,595 |
25.94% |
35.99% |
61.93% |
2.09% |
0.00% |
1,479,692 |
2,546,287 |
85,836 |
0 |
 |  | 1990 |
3,796,625 |
2 |
1 |
0 |
44,318 |
1.17% |
47.94% |
49.11% |
0.00% |
2.95% |
1,820,145 |
1,864,463 |
0 |
112,017 |
|
