| Map | Pie | Year | Total | D | R | I | Margin | %Margin | Dem | Rep | Ind | Oth. | Dem | Rep | Ind | Other | | | | | | | | | | | | | | | | | | |
|---|
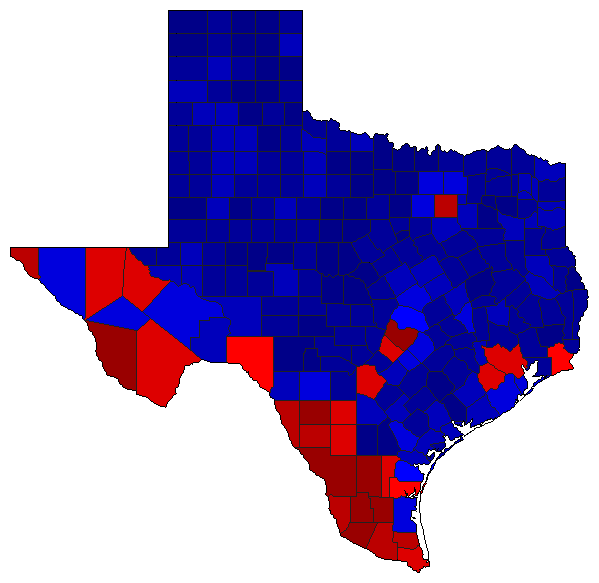
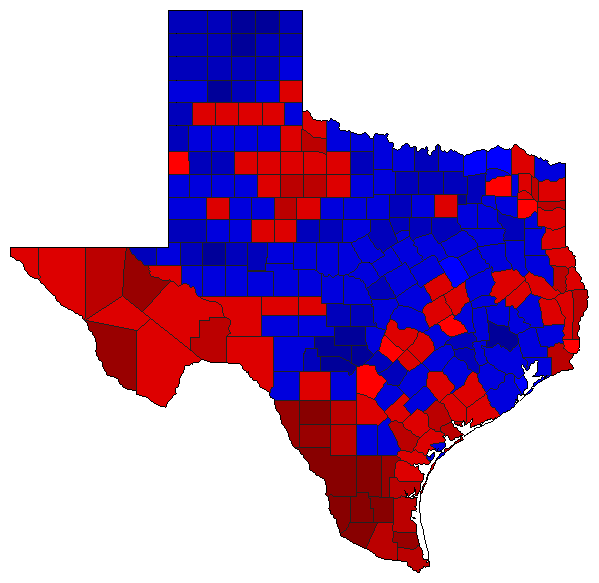
|  | 2022 |
8,032,444 |
2 |
1 |
0 |
825,148 |
10.27% |
43.48% |
53.75% |
0.00% |
2.77% |
3,492,544 |
4,317,692 |
0 |
222,208 |
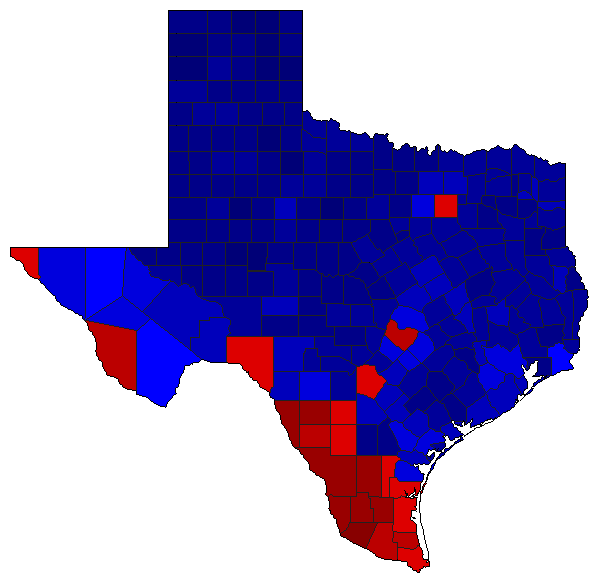
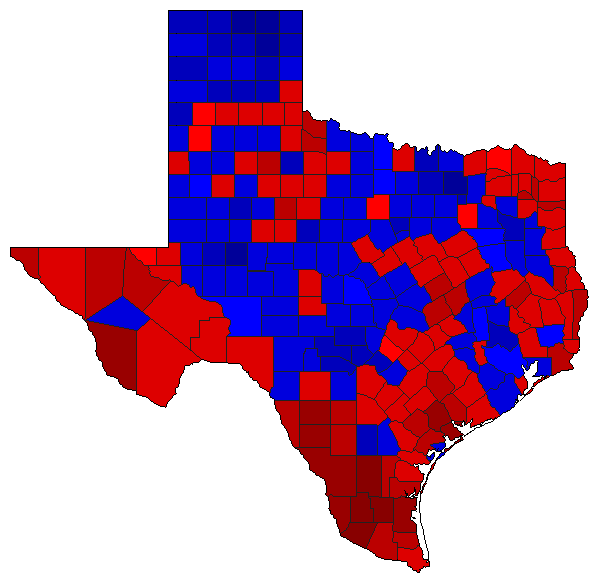
 |  | 2018 |
8,305,371 |
2 |
1 |
0 |
400,125 |
4.82% |
46.49% |
51.30% |
0.00% |
2.21% |
3,860,865 |
4,260,990 |
0 |
183,516 |
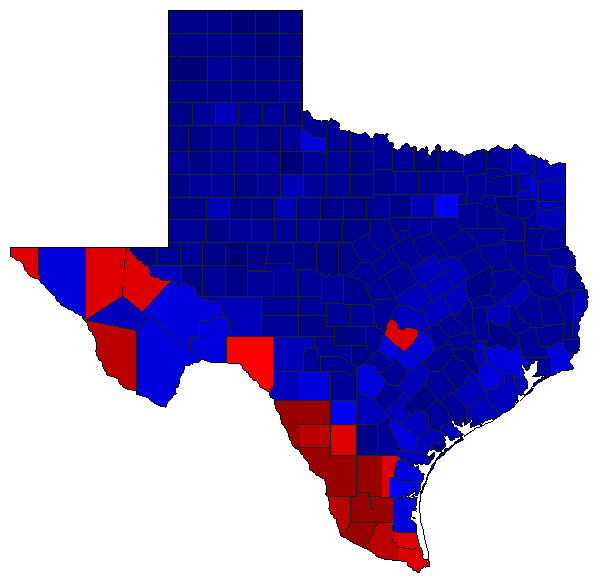
 | | 2014 |
4,686,019 |
2 |
1 |
0 |
910,519 |
19.43% |
38.71% |
58.14% |
0.00% |
3.15% |
1,813,974 |
2,724,493 |
0 |
147,552 |
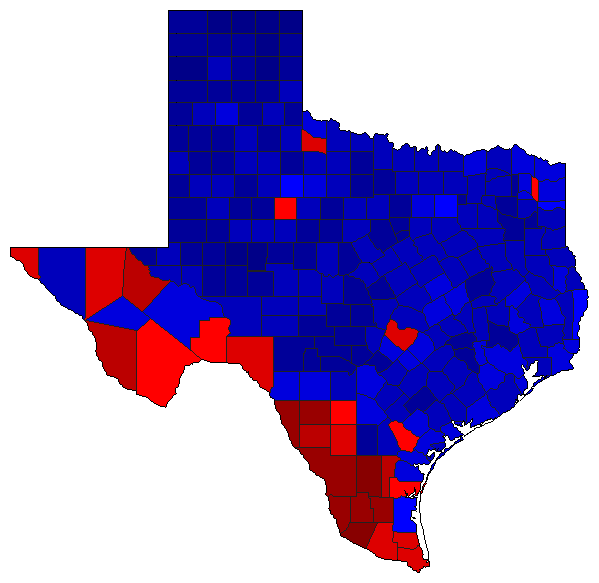
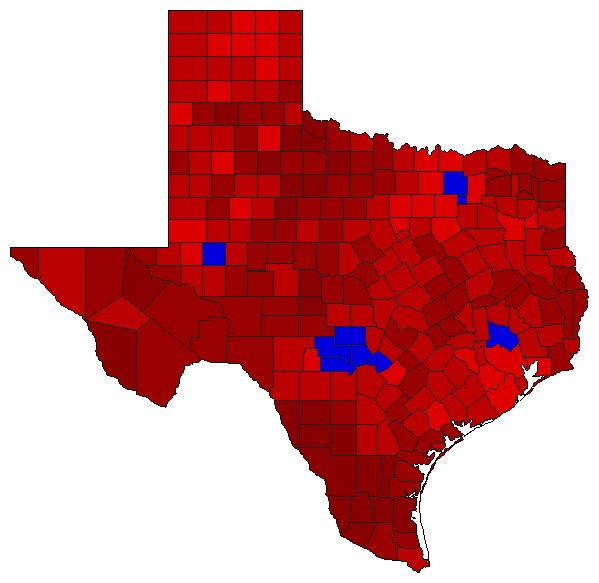
 | | 2010 |
4,935,356 |
2 |
1 |
0 |
1,329,907 |
26.95% |
34.83% |
61.78% |
0.00% |
3.38% |
1,719,202 |
3,049,109 |
0 |
167,045 |
 | | 2006 |
4,321,386 |
2 |
1 |
0 |
896,891 |
20.75% |
37.44% |
58.20% |
0.00% |
4.36% |
1,618,045 |
2,514,936 |
0 |
188,405 |
 | | 2002 |
4,523,427 |
2 |
1 |
0 |
259,594 |
5.74% |
46.03% |
51.77% |
0.00% |
2.19% |
2,082,281 |
2,341,875 |
0 |
99,271 |
 | | 1998 |
3,714,093 |
2 |
1 |
0 |
68,731 |
1.85% |
48.20% |
50.05% |
0.00% |
1.75% |
1,790,106 |
1,858,837 |
0 |
65,150 |
 | | 1994 |
4,280,691 |
1 |
2 |
0 |
982,995 |
22.96% |
61.48% |
38.52% |
0.00% |
0.00% |
2,631,843 |
1,648,848 |
0 |
0 |
|
