Note: The Google advertisement links below may advocate political positions that this site does not endorse.
| Map | Pie | Office | Total | D | R | I | Margin | %Margin | Dem | Rep | Ind | Oth. | Dem | Rep | Ind | Other | | | | | | | | | | | | | | | | | | |
|---|
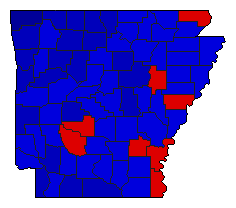
 |  | Governor |
719,550 |
1 |
2 |
0 |
138,206 |
19.21% |
59.60% |
40.40% |
0.00% |
0.00% |
428,878 |
290,672 |
0 |
0 |
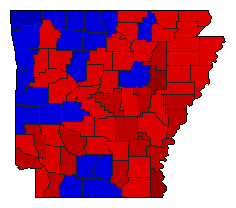
 | | Lt. Governor |
712,148 |
2 |
1 |
0 |
122,234 |
17.16% |
41.42% |
58.58% |
0.00% |
0.00% |
294,957 |
417,191 |
0 |
0 |
 | | Secretary of State |
698,543 |
1 |
2 |
0 |
34,697 |
4.97% |
52.48% |
47.52% |
0.00% |
0.00% |
366,620 |
331,923 |
0 |
0 |
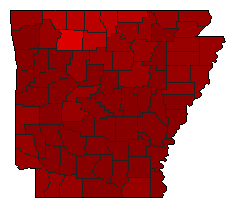 | | Attorney General |
696,792 |
1 |
2 |
0 |
424,636 |
60.94% |
80.47% |
19.53% |
0.00% |
0.00% |
560,714 |
136,078 |
0 |
0 |
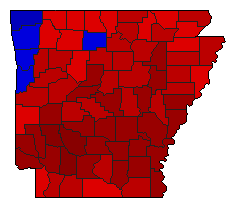 | | State Auditor |
672,358 |
1 |
2 |
0 |
174,256 |
25.92% |
62.96% |
37.04% |
0.00% |
0.00% |
423,307 |
249,051 |
0 |
0 |
| | | Map | Pie | Initiative | Total Vote | N | | Y | Margin | %Margin | No | | Yes | Oth. | No | | Yes | |
 |  | Referendum |
664,331 |
2 |
0 |
1 |
69,463 |
10.46% |
44.77% |
0.00% |
55.23% |
0.00% |
297,434 |
0 |
366,897 |
0 |
|
