1994 General Election Results Comparison - Washington
| Map | Pie | Office | Total | D | R | I | Margin | %Margin | Dem | Rep | Ind | Oth. | Dem | Rep | Ind | Other |
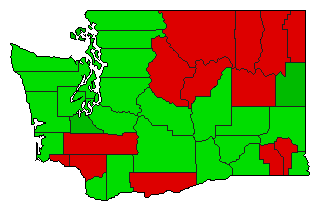
 |  | Senator | 1,700,173 | 2 | 1 | 0 | 195,469 | 11.50% | 44.25% | 55.75% | 0.00% | 0.00% | 752,352 | 947,821 | 0 | 0 |
| Map | Pie | Initiative | Total Vote | N | Y | Margin | %Margin | No | Yes | Oth. | No | Yes | ||||
 | Referendum | 1,660,422 | 2 | 0 | 1 | 235,272 | 14.17% | 42.92% | 0.00% | 57.08% | 0.00% | 712,575 | 0 | 947,847 | 0 | |
 | Initiative | 1,659,579 | 2 | 0 | 1 | 252,341 | 15.21% | 42.40% | 0.00% | 57.60% | 0.00% | 703,619 | 0 | 955,960 | 0 | |
Washington Results for 1994
Login
© Dave Leip's Atlas of U.S. Elections, LLC 2019 All Rights Reserved
Note: The advertisement links below may advocate political positions that this site does not endorse.
Login
© Dave Leip's Atlas of U.S. Elections, LLC 2019 All Rights Reserved
Note: The advertisement links below may advocate political positions that this site does not endorse.