| Map | Pie | Office | Total | D | R | I | Margin | %Margin | Dem | Rep | Ind | Oth. | Dem | Rep | Ind | Other | | | | | | | | | | | | | | | | | | |
|---|
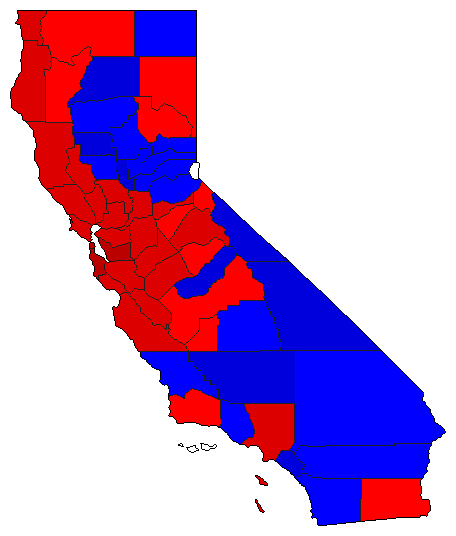
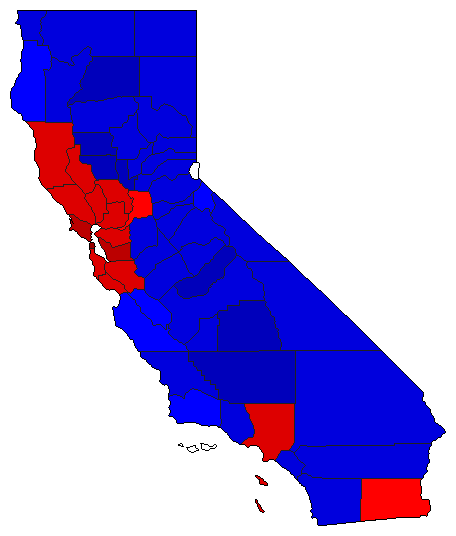
 |  | Senator |
8,514,089 |
1 |
2 |
0 |
162,127 |
1.90% |
46.74% |
44.83% |
0.00% |
8.43% |
3,979,152 |
3,817,025 |
0 |
717,912 |
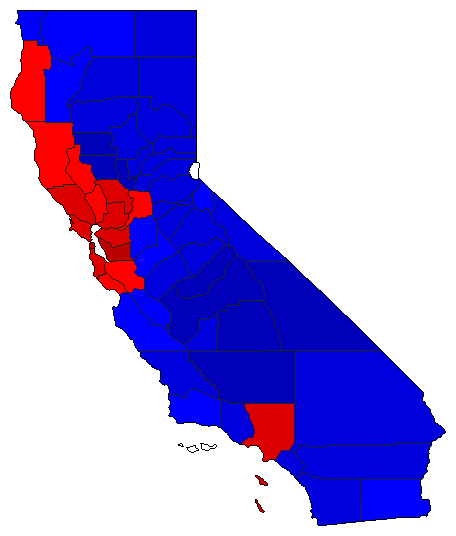
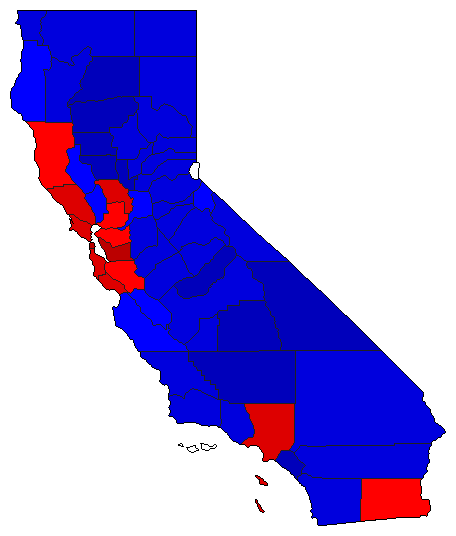
 |  | Governor |
8,665,375 |
2 |
1 |
0 |
1,261,967 |
14.56% |
40.62% |
55.18% |
0.00% |
4.20% |
3,519,799 |
4,781,766 |
0 |
363,810 |
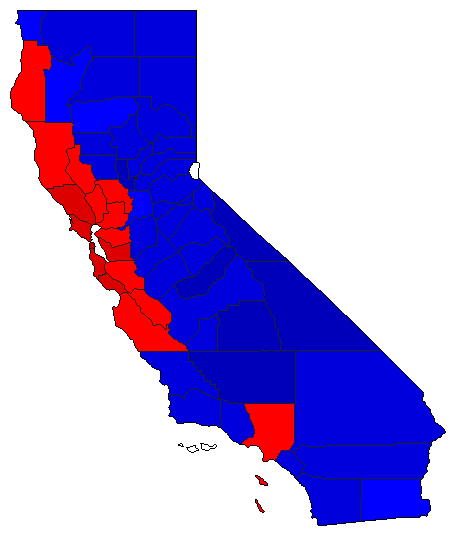
 | | Lt. Governor |
8,473,091 |
1 |
2 |
0 |
1,028,652 |
12.14% |
52.42% |
40.28% |
0.00% |
7.30% |
4,441,429 |
3,412,777 |
0 |
618,885 |
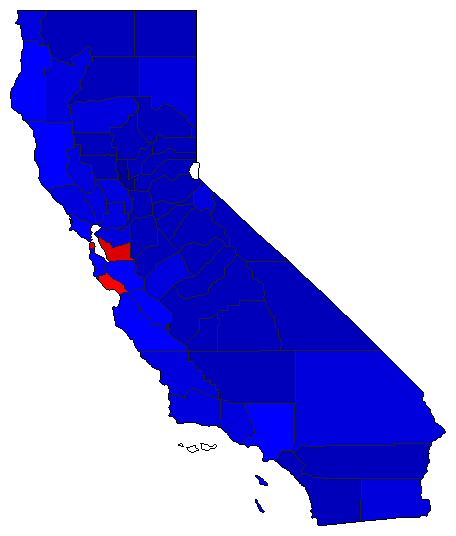
 | | Secretary of State |
8,234,198 |
2 |
1 |
0 |
37,053 |
0.45% |
44.82% |
45.27% |
0.00% |
9.90% |
3,690,841 |
3,727,894 |
0 |
815,463 |
 | | State Treasurer |
8,193,784 |
2 |
1 |
0 |
481,417 |
5.88% |
42.58% |
48.46% |
0.00% |
8.97% |
3,488,891 |
3,970,308 |
0 |
734,585 |
 | | Attorney General |
8,240,597 |
2 |
1 |
0 |
1,182,663 |
14.35% |
39.51% |
53.86% |
0.00% |
6.62% |
3,256,070 |
4,438,733 |
0 |
545,794 |
 | | Controller |
8,243,010 |
1 |
2 |
0 |
186,666 |
2.26% |
48.32% |
46.06% |
0.00% |
5.62% |
3,983,053 |
3,796,387 |
0 |
463,570 |
 | | Insurance Commissioner |
8,225,487 |
2 |
1 |
0 |
447,862 |
5.44% |
43.38% |
48.82% |
0.00% |
7.80% |
3,567,996 |
4,015,858 |
0 |
641,633 |
| | | Map | Pie | Initiative | Total Vote | N | | Y | Margin | %Margin | No | | Yes | Oth. | No | | Yes | |
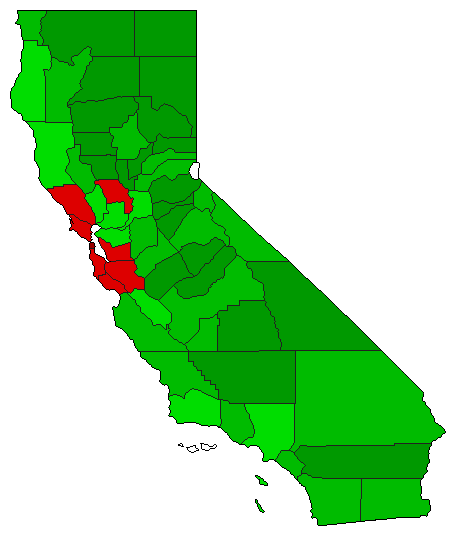 | | Initiative |
8,592,969 |
2 |
0 |
1 |
1,534,105 |
17.85% |
41.07% |
0.00% |
58.93% |
0.00% |
3,529,432 |
0 |
5,063,537 |
0 |
|
