| Map | Pie | Year | Total | D | R | I | Margin | %Margin | Dem | Rep | Ind | Oth. | Dem | Rep | Ind | Other | | | | | | | | | | | | | | | | | | |
|---|
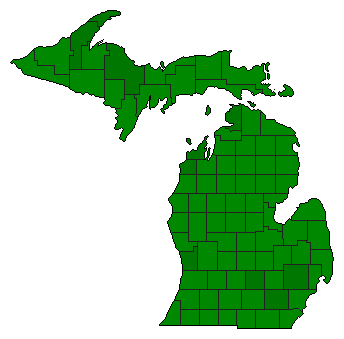 |  | 2020 |
5,039,801 |
2 |
0 |
1 |
3,905,541 |
77.49% |
11.25% |
0.00% |
88.75% |
0.00% |
567,130 |
0 |
4,472,671 |
0 |
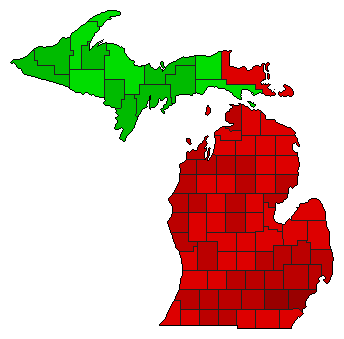 | | 2014 |
2,908,029 |
1 |
0 |
2 |
805,177 |
27.69% |
63.84% |
0.00% |
36.16% |
0.00% |
1,856,603 |
0 |
1,051,426 |
0 |
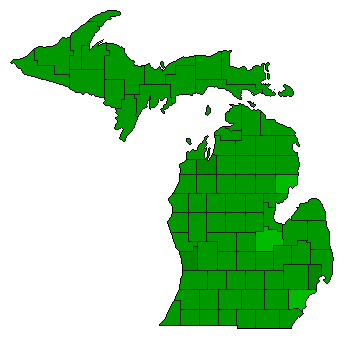 | | 2010 |
3,031,243 |
2 |
0 |
1 |
1,510,071 |
49.82% |
25.09% |
0.00% |
74.91% |
0.00% |
760,586 |
0 |
2,270,657 |
0 |
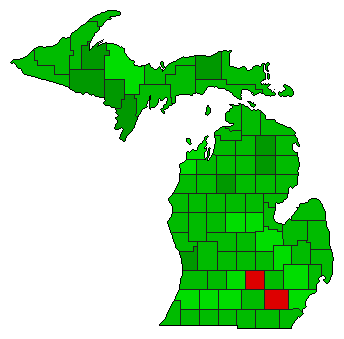
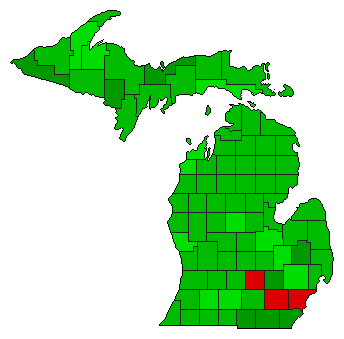 | | 2006 |
3,696,701 |
2 |
0 |
1 |
585,319 |
15.83% |
42.08% |
0.00% |
57.92% |
0.00% |
1,555,691 |
0 |
2,141,010 |
0 |
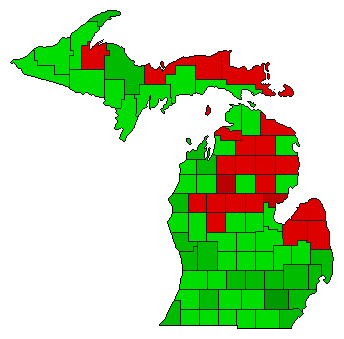
 | | 2004 |
4,602,396 |
2 |
0 |
1 |
793,758 |
17.25% |
41.38% |
0.00% |
58.62% |
0.00% |
1,904,319 |
0 |
2,698,077 |
0 |
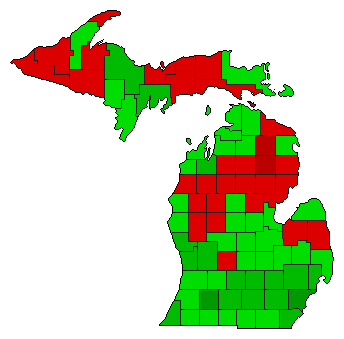
 | | 2002 |
2,946,665 |
2 |
0 |
1 |
601,441 |
20.41% |
39.79% |
0.00% |
60.21% |
0.00% |
1,172,612 |
0 |
1,774,053 |
0 |
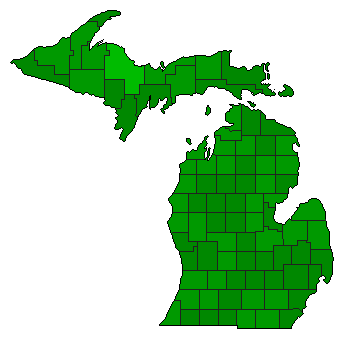
 |  | 1998 |
2,902,994 |
2 |
0 |
1 |
739,018 |
25.46% |
37.27% |
0.00% |
62.73% |
0.00% |
1,081,988 |
0 |
1,821,006 |
0 |
 | | 1996 |
3,458,694 |
2 |
0 |
1 |
2,198,662 |
63.57% |
18.22% |
0.00% |
81.78% |
0.00% |
630,016 |
0 |
2,828,678 |
0 |
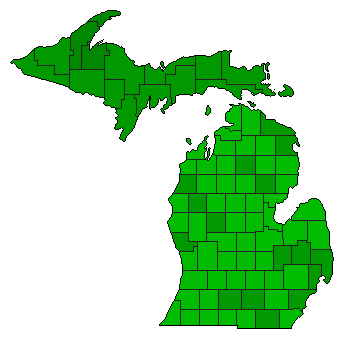 | | 1974 |
2,368,682 |
2 |
0 |
1 |
968,600 |
40.89% |
29.55% |
0.00% |
70.45% |
0.00% |
700,041 |
0 |
1,668,641 |
0 |
 | | 1970 |
2,310,219 |
1 |
0 |
2 |
467,255 |
20.23% |
60.11% |
0.00% |
39.89% |
0.00% |
1,388,737 |
0 |
921,482 |
0 |
|