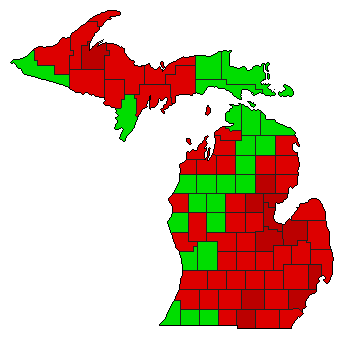
1996 General Election Results Comparison - Michigan
| Map | Pie | Office | Total | D | R | I | Margin | %Margin | Dem | Rep | Ind | Oth. | Dem | Rep | Ind | Other |
 |  | President | 3,848,844 | 1 | 2 | 3 | 508,441 | 13.21% | 51.69% | 38.48% | 8.75% | 1.07% | 1,989,653 | 1,481,212 | 336,670 | 41,309 |
 |  | Senator | 3,762,575 | 1 | 2 | 0 | 695,632 | 18.49% | 58.36% | 39.87% | 0.00% | 1.77% | 2,195,738 | 1,500,106 | 0 | 66,731 |
| Map | Pie | Initiative | Total Vote | N | Y | Margin | %Margin | No | Yes | Oth. | No | Yes | ||||
 | Referendum | 3,447,261 | 1 | 0 | 2 | 425,135 | 12.33% | 56.17% | 0.00% | 43.83% | 0.00% | 1,936,198 | 0 | 1,511,063 | 0 | |
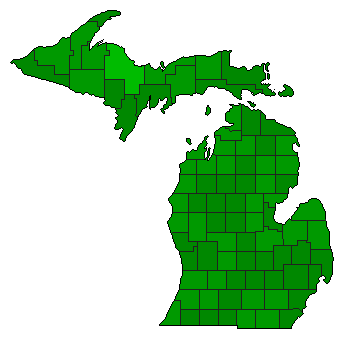 | Referendum | 3,458,694 | 2 | 0 | 1 | 2,198,662 | 63.57% | 18.22% | 0.00% | 81.78% | 0.00% | 630,016 | 0 | 2,828,678 | 0 | |
Michigan Results for 1996
Login
© Dave Leip's Atlas of U.S. Elections, LLC 2019 All Rights Reserved
Note: The advertisement links below may advocate political positions that this site does not endorse.
Login
© Dave Leip's Atlas of U.S. Elections, LLC 2019 All Rights Reserved
Note: The advertisement links below may advocate political positions that this site does not endorse.