| Map | Pie | Office | Total | D | R | I | Margin | %Margin | Dem | Rep | Ind | Oth. | Dem | Rep | Ind | Other | | | | | | | | | | | | | | | | | | |
|---|
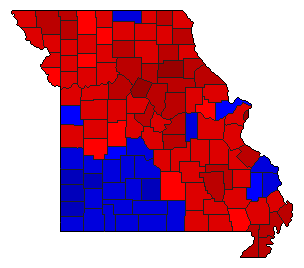
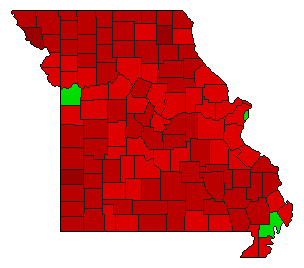
 |  | President |
2,158,065 |
1 |
2 |
3 |
135,919 |
6.30% |
47.54% |
41.24% |
10.06% |
1.16% |
1,025,935 |
890,016 |
217,188 |
24,926 |
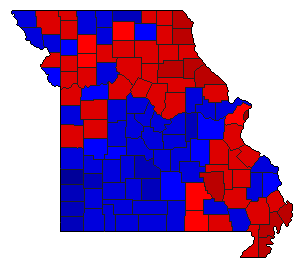
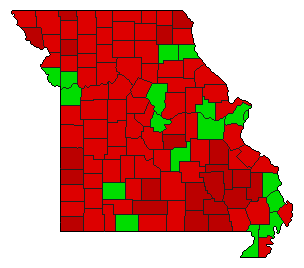
 |  | Governor |
2,142,518 |
1 |
2 |
0 |
358,533 |
16.73% |
57.17% |
40.43% |
0.00% |
2.40% |
1,224,801 |
866,268 |
0 |
51,449 |
 | | Lt. Governor |
2,110,300 |
1 |
2 |
0 |
232,562 |
11.02% |
53.52% |
42.50% |
0.00% |
3.98% |
1,129,409 |
896,847 |
0 |
84,044 |
 | | Secretary of State |
2,109,328 |
1 |
2 |
0 |
69,068 |
3.27% |
49.95% |
46.68% |
0.00% |
3.37% |
1,053,681 |
984,613 |
0 |
71,034 |
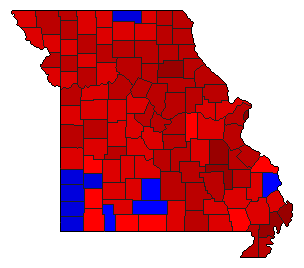
 | | State Treasurer |
2,078,196 |
1 |
2 |
0 |
394,144 |
18.97% |
57.06% |
38.09% |
0.00% |
4.84% |
1,185,832 |
791,688 |
0 |
100,676 |
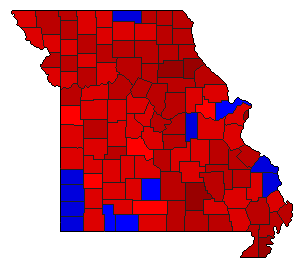
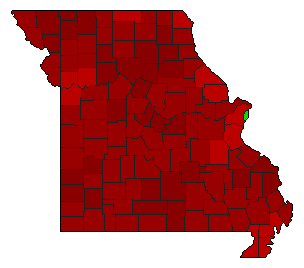
 | | Attorney General |
2,092,127 |
1 |
2 |
0 |
475,129 |
22.71% |
59.42% |
36.71% |
0.00% |
3.88% |
1,243,091 |
767,962 |
0 |
81,074 |
| | | Map | Pie | Initiative | Total Vote | N | | Y | Margin | %Margin | No | | Yes | Oth. | No | | Yes | |
 | | Referendum |
1,914,498 |
1 |
0 |
2 |
218,032 |
11.39% |
55.69% |
0.00% |
44.31% |
0.00% |
1,066,265 |
0 |
848,233 |
0 |
 | | Referendum |
1,882,420 |
1 |
0 |
2 |
10,016 |
0.53% |
50.27% |
0.00% |
49.73% |
0.00% |
946,218 |
0 |
936,202 |
0 |
 | | Referendum |
1,922,038 |
2 |
0 |
1 |
638,452 |
33.22% |
33.39% |
0.00% |
66.61% |
0.00% |
641,793 |
0 |
1,280,245 |
0 |
 | | Referendum |
1,863,200 |
2 |
0 |
1 |
287,230 |
15.42% |
42.29% |
0.00% |
57.71% |
0.00% |
787,985 |
0 |
1,075,215 |
0 |
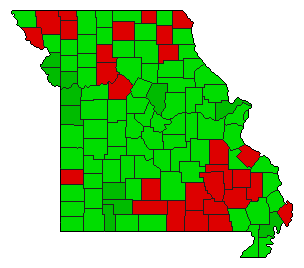
 | | Initiative |
2,043,566 |
1 |
0 |
2 |
870,398 |
42.59% |
71.30% |
0.00% |
28.70% |
0.00% |
1,456,982 |
0 |
586,584 |
0 |
|
