| Map | Pie | Year | Total | D | R | I | Margin | %Margin | Dem | Rep | Ind | Oth. | Dem | Rep | Ind | Other | | | | | | | | | | | | | | | | | | |
|---|
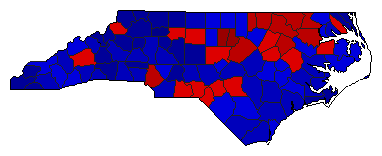 |  | 2020 |
5,361,951 |
2 |
1 |
0 |
189,023 |
3.53% |
48.24% |
51.76% |
0.00% |
0.00% |
2,586,464 |
2,775,487 |
0 |
0 |
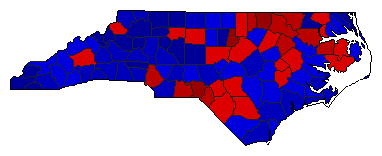 |  | 2016 |
4,505,794 |
2 |
1 |
0 |
35,888 |
0.80% |
49.60% |
50.40% |
0.00% |
0.00% |
2,234,953 |
2,270,841 |
0 |
0 |
 | | 2012 |
4,292,945 |
1 |
2 |
0 |
159,743 |
3.72% |
51.86% |
48.14% |
0.00% |
0.00% |
2,226,344 |
2,066,601 |
0 |
0 |
 | | 2008 |
4,085,197 |
1 |
2 |
0 |
284,418 |
6.96% |
51.57% |
44.61% |
0.00% |
3.82% |
2,106,870 |
1,822,452 |
0 |
155,875 |
 | | 2004 |
3,355,474 |
1 |
2 |
0 |
512,678 |
15.28% |
57.64% |
42.36% |
0.00% |
0.00% |
1,934,076 |
1,421,398 |
0 |
0 |
 | | 2000 |
2,812,666 |
1 |
2 |
0 |
367,612 |
13.07% |
56.53% |
43.47% |
0.00% |
0.00% |
1,590,139 |
1,222,527 |
0 |
0 |
 | | 1996 |
2,447,873 |
1 |
2 |
0 |
378,112 |
15.45% |
56.74% |
41.29% |
0.00% |
1.97% |
1,388,894 |
1,010,782 |
0 |
48,197 |
 |  | 1984 |
2,038,479 |
1 |
2 |
0 |
168,675 |
8.27% |
54.14% |
45.86% |
0.00% |
0.00% |
1,103,577 |
934,902 |
0 |
0 |
 |  | 1968 |
1,419,673 |
1 |
2 |
0 |
168,489 |
11.87% |
55.93% |
44.07% |
0.00% |
0.00% |
794,081 |
625,592 |
0 |
0 |
|
