| Map | Pie | Office | Total | D | R | I | Margin | %Margin | Dem | Rep | Ind | Oth. | Dem | Rep | Ind | Other | | | | | | | | | | | | | | | | | | |
|---|
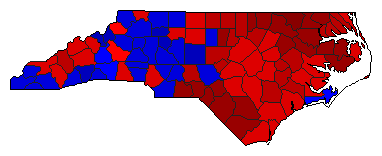
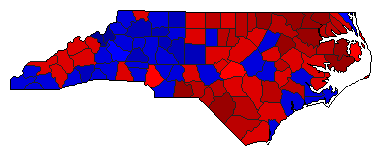
 |  | President |
2,515,807 |
2 |
1 |
3 |
118,089 |
4.69% |
44.04% |
48.73% |
6.68% |
0.55% |
1,107,849 |
1,225,938 |
168,059 |
13,961 |
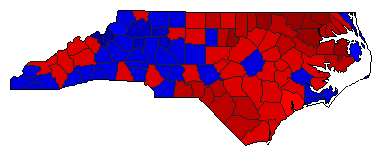
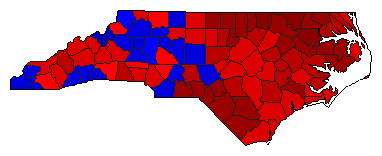
 |  | Senator |
2,556,456 |
2 |
1 |
0 |
171,958 |
6.73% |
45.92% |
52.64% |
0.00% |
1.44% |
1,173,875 |
1,345,833 |
0 |
36,748 |
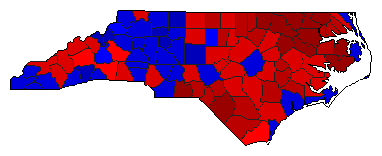
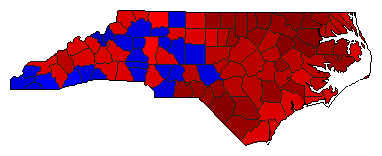
 |  | Governor |
2,566,185 |
1 |
2 |
0 |
339,585 |
13.23% |
55.98% |
42.75% |
0.00% |
1.27% |
1,436,638 |
1,097,053 |
0 |
32,494 |
 | | Lt. Governor |
2,458,372 |
1 |
2 |
0 |
245,362 |
9.98% |
54.50% |
44.52% |
0.00% |
0.97% |
1,339,893 |
1,094,531 |
0 |
23,948 |
 | | Secretary of State |
2,494,325 |
1 |
2 |
0 |
207,293 |
8.31% |
53.48% |
45.17% |
0.00% |
1.35% |
1,333,994 |
1,126,701 |
0 |
33,630 |
 | | State Treasurer |
2,409,086 |
1 |
2 |
0 |
74,845 |
3.11% |
50.62% |
47.52% |
0.00% |
1.86% |
1,219,594 |
1,144,749 |
0 |
44,743 |
 | | Attorney General |
2,460,223 |
1 |
2 |
0 |
446,169 |
18.14% |
59.07% |
40.93% |
0.00% |
0.00% |
1,453,196 |
1,007,027 |
0 |
0 |
 | | State Auditor |
2,373,193 |
1 |
2 |
0 |
55,615 |
2.34% |
49.92% |
47.58% |
0.00% |
2.51% |
1,184,665 |
1,129,050 |
0 |
59,478 |
 | | Insurance Commissioner |
2,447,873 |
1 |
2 |
0 |
378,112 |
15.45% |
56.74% |
41.29% |
0.00% |
1.97% |
1,388,894 |
1,010,782 |
0 |
48,197 |
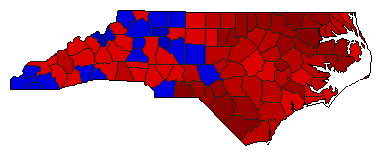
 |  | Agriculture Commissioner |
2,439,294 |
1 |
2 |
4 |
429,577 |
17.61% |
57.80% |
40.18% |
0.99% |
1.03% |
1,409,801 |
980,224 |
24,217 |
25,052 |
|
