| Map | Pie | Office | Total | D | R | I | Margin | %Margin | Dem | Rep | Ind | Oth. | Dem | Rep | Ind | Other | | | | | | | | | | | | | | | | | | |
|---|
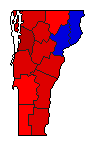
 |  | President |
258,449 |
1 |
2 |
3 |
57,542 |
22.26% |
53.35% |
31.09% |
12.00% |
3.55% |
137,894 |
80,352 |
31,024 |
9,179 |
 |  | Governor |
254,648 |
1 |
2 |
4 |
122,383 |
48.06% |
70.51% |
22.45% |
1.26% |
5.79% |
179,544 |
57,161 |
3,201 |
14,742 |
 | | Lt. Governor |
250,411 |
1 |
2 |
3 |
32,749 |
13.08% |
54.14% |
41.06% |
2.11% |
2.69% |
135,567 |
102,818 |
5,296 |
6,730 |
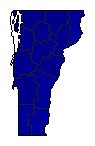 | | Secretary of State |
232,374 |
0 |
1 |
0 |
171,888 |
73.97% |
0.00% |
81.41% |
0.00% |
18.59% |
0 |
189,171 |
0 |
43,203 |
 |  | State Treasurer |
236,882 |
0 |
1 |
2 |
186,684 |
78.81% |
0.00% |
85.85% |
7.04% |
7.12% |
0 |
203,355 |
16,671 |
16,856 |
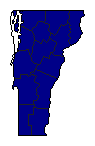 |  | Attorney General |
238,708 |
0 |
1 |
0 |
193,785 |
81.18% |
0.00% |
87.23% |
0.00% |
12.77% |
0 |
208,228 |
0 |
30,480 |
|
