| Map | Pie | Office | Total | D | R | I | Margin | %Margin | Dem | Rep | Ind | Oth. | Dem | Rep | Ind | Other | | | | | | | | | | | | | | | | | | |
|---|
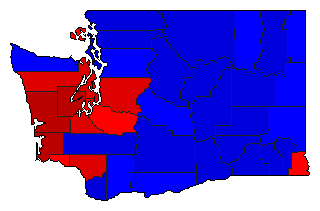
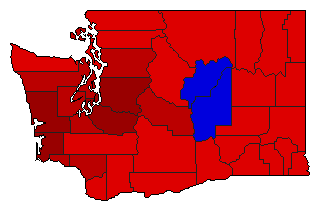
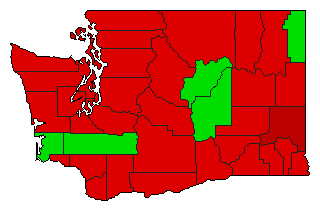
 |  | President |
2,253,837 |
1 |
2 |
3 |
282,611 |
12.54% |
49.84% |
37.30% |
8.92% |
3.94% |
1,123,323 |
840,712 |
201,003 |
88,799 |
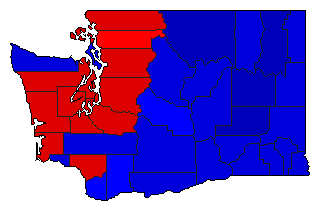
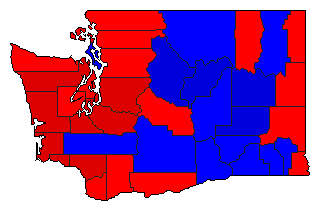
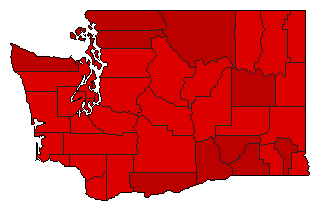
 |  | Governor |
2,237,030 |
1 |
2 |
0 |
355,954 |
15.91% |
57.96% |
42.04% |
0.00% |
0.00% |
1,296,492 |
940,538 |
0 |
0 |
 | | Lt. Governor |
2,130,326 |
1 |
2 |
0 |
33,217 |
1.56% |
48.02% |
46.46% |
0.00% |
5.53% |
1,022,878 |
989,661 |
0 |
117,787 |
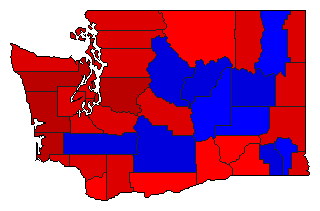
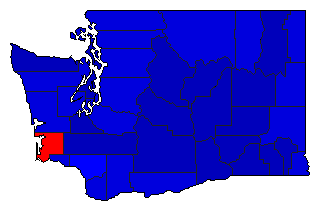 | | Secretary of State |
2,135,630 |
2 |
1 |
0 |
385,137 |
18.03% |
39.27% |
57.30% |
0.00% |
3.43% |
838,632 |
1,223,769 |
0 |
73,229 |
 | | State Treasurer |
2,095,076 |
1 |
2 |
0 |
215,920 |
10.31% |
55.15% |
44.85% |
0.00% |
0.00% |
1,155,498 |
939,578 |
0 |
0 |
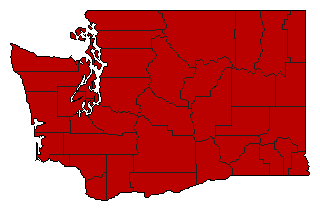
 | | Attorney General |
2,135,586 |
1 |
2 |
0 |
526,316 |
24.65% |
60.08% |
35.43% |
0.00% |
4.49% |
1,282,955 |
756,639 |
0 |
95,992 |
 | | Comptroller General |
2,106,713 |
1 |
2 |
0 |
158,394 |
7.52% |
52.15% |
44.63% |
0.00% |
3.23% |
1,098,548 |
940,154 |
0 |
68,011 |
 | | State Auditor |
2,085,955 |
1 |
2 |
0 |
591,199 |
28.34% |
64.17% |
35.83% |
0.00% |
0.00% |
1,338,577 |
747,378 |
0 |
0 |
 | | Controller |
2,253,837 |
1 |
2 |
3 |
282,611 |
12.54% |
49.84% |
37.30% |
8.92% |
3.94% |
1,123,323 |
840,712 |
201,003 |
88,799 |
 | | Insurance Commissioner |
2,102,460 |
1 |
2 |
0 |
291,552 |
13.87% |
55.36% |
41.49% |
0.00% |
3.16% |
1,163,832 |
872,280 |
0 |
66,348 |
| | | Map | Pie | Initiative | Total Vote | N | | Y | Margin | %Margin | No | | Yes | Oth. | No | | Yes | |
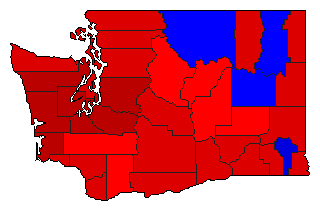
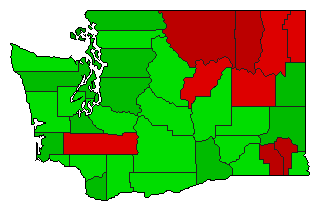 | | Initiative |
2,202,962 |
2 |
0 |
1 |
572,192 |
25.97% |
37.01% |
0.00% |
62.99% |
0.00% |
815,385 |
0 |
1,387,577 |
0 |
 | | Initiative |
2,084,738 |
1 |
0 |
2 |
208,992 |
10.02% |
55.01% |
0.00% |
44.99% |
0.00% |
1,146,865 |
0 |
937,873 |
0 |
 | | Initiative |
2,156,836 |
1 |
0 |
2 |
288,148 |
13.36% |
56.68% |
0.00% |
43.32% |
0.00% |
1,222,492 |
0 |
934,344 |
0 |
 | | Initiative |
2,181,714 |
1 |
0 |
2 |
631,152 |
28.93% |
64.46% |
0.00% |
35.54% |
0.00% |
1,406,433 |
0 |
775,281 |
0 |
 | | Initiative |
2,143,183 |
1 |
0 |
2 |
618,449 |
28.86% |
64.43% |
0.00% |
35.57% |
0.00% |
1,380,816 |
0 |
762,367 |
0 |
|
