1996 General Election Results Comparison - California
| Map | Pie | Office | Total | D | R | I | Margin | %Margin | Dem | Rep | Ind | Oth. | Dem | Rep | Ind | Other |
 |  | President | 10,019,484 | 1 | 2 | 3 | 1,291,455 | 12.89% | 51.10% | 38.21% | 6.96% | 3.73% | 5,119,835 | 3,828,380 | 697,847 | 373,422 |
| Map | Pie | Initiative | Total Vote | N | Y | Margin | %Margin | No | Yes | Oth. | No | Yes | ||||
 | Initiative | 9,580,035 | 2 | 0 | 1 | 2,459,867 | 25.68% | 37.16% | 0.00% | 62.84% | 0.00% | 3,560,084 | 0 | 6,019,951 | 0 | |
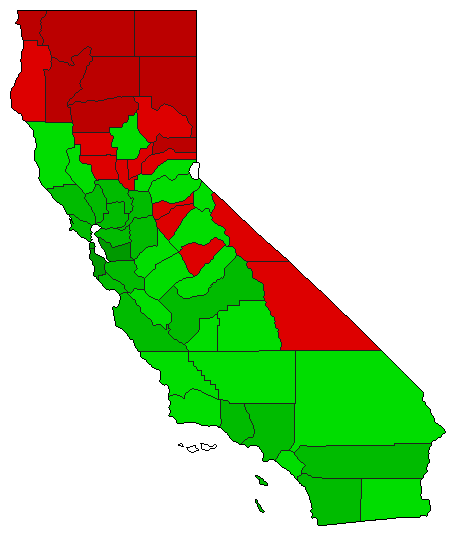
 |  | Initiative | 9,657,195 | 2 | 0 | 1 | 879,729 | 9.11% | 45.45% | 0.00% | 54.55% | 0.00% | 4,388,733 | 0 | 5,268,462 | 0 |
California Results for 1996
Login
© Dave Leip's Atlas of U.S. Elections, LLC 2019 All Rights Reserved
Note: The advertisement links below may advocate political positions that this site does not endorse.
Login
© Dave Leip's Atlas of U.S. Elections, LLC 2019 All Rights Reserved
Note: The advertisement links below may advocate political positions that this site does not endorse.