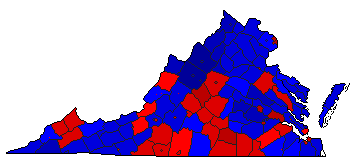
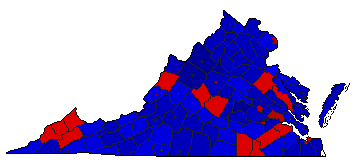
Note: The Google advertisement links below may advocate political positions that this site does not endorse.
| Map | Pie | Office | Total | D | R | I | Margin | %Margin | Dem | Rep | Ind | Oth. | Dem | Rep | Ind | Other | | | | | | | | | | | | | | | | | | |
|---|
 |  | Governor |
1,736,314 |
2 |
1 |
0 |
230,091 |
13.25% |
42.56% |
55.81% |
0.00% |
1.63% |
738,971 |
969,062 |
0 |
28,281 |
 | | Lt. Governor |
1,674,521 |
2 |
1 |
0 |
85,491 |
5.11% |
45.05% |
50.16% |
0.00% |
4.79% |
754,404 |
839,895 |
0 |
80,222 |
 | | Attorney General |
1,658,371 |
2 |
1 |
0 |
250,932 |
15.13% |
42.36% |
57.49% |
0.00% |
0.14% |
702,523 |
953,455 |
0 |
2,393 |
|