| Map | Pie | Year | Total | D | R | I | Margin | %Margin | Dem | Rep | Ind | Oth. | Dem | Rep | Ind | Other | | | | | | | | | | | | | | | | | | |
|---|
|  | 2022 |
1,144,297 |
0 |
1 |
0 |
778,874 |
68.07% |
0.00% |
83.68% |
0.00% |
16.32% |
0 |
957,534 |
0 |
186,763 |
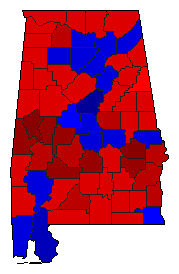
 |  | 2018 |
1,705,977 |
2 |
1 |
0 |
384,928 |
22.56% |
38.69% |
61.25% |
0.00% |
0.06% |
660,013 |
1,044,941 |
0 |
1,023 |
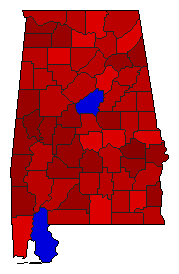
 | | 2014 |
1,167,243 |
2 |
1 |
0 |
310,083 |
26.57% |
36.67% |
63.23% |
0.00% |
0.10% |
428,007 |
738,090 |
0 |
1,146 |
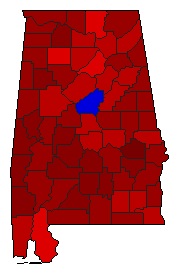
 | | 2010 |
1,477,090 |
2 |
1 |
0 |
45,160 |
3.06% |
48.47% |
51.53% |
0.00% |
0.00% |
715,965 |
761,125 |
0 |
0 |
 | | 2006 |
1,243,279 |
1 |
2 |
0 |
18,286 |
1.47% |
50.61% |
49.14% |
0.00% |
0.24% |
629,268 |
610,982 |
0 |
3,029 |
 | | 2002 |
1,349,038 |
1 |
2 |
0 |
63,603 |
4.71% |
51.48% |
46.76% |
0.00% |
1.76% |
694,442 |
630,839 |
0 |
23,757 |
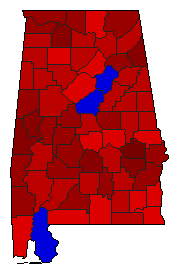
 | | 1998 |
1,297,283 |
2 |
1 |
0 |
7,647 |
0.59% |
49.71% |
50.29% |
0.00% |
0.00% |
644,818 |
652,465 |
0 |
0 |
 | | 1994 |
1,174,992 |
1 |
2 |
0 |
289,578 |
24.65% |
62.32% |
37.68% |
0.00% |
0.00% |
732,285 |
442,707 |
0 |
0 |
 | | 1990 |
1,142,060 |
1 |
2 |
0 |
395,916 |
34.67% |
67.33% |
32.67% |
0.00% |
0.00% |
768,988 |
373,072 |
0 |
0 |
 | | 1986 |
1,174,089 |
1 |
2 |
0 |
278,133 |
23.69% |
61.84% |
38.16% |
0.00% |
0.00% |
726,111 |
447,978 |
0 |
0 |
 | | 1970 |
825,352 |
1 |
2 |
3 |
463,112 |
56.11% |
71.44% |
15.33% |
11.17% |
2.07% |
589,618 |
126,506 |
92,176 |
17,052 |
|
