| Map | Pie | Year | Total | D | R | I | Margin | %Margin | Dem | Rep | Ind | Oth. | Dem | Rep | Ind | Other | | | | | | | | | | | | | | | | | | |
|---|
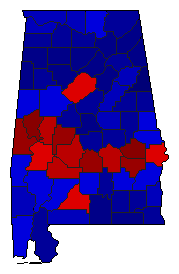
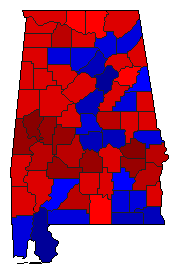
|  | 2022 |
1,404,403 |
2 |
1 |
0 |
488,405 |
34.78% |
31.11% |
65.88% |
0.00% |
3.01% |
436,862 |
925,267 |
0 |
42,274 |
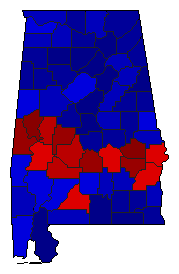
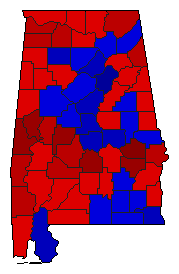
 |  | 2018 |
1,692,026 |
2 |
1 |
0 |
373,888 |
22.10% |
38.92% |
61.02% |
0.00% |
0.06% |
658,537 |
1,032,425 |
0 |
1,064 |
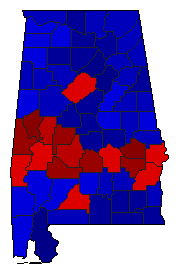
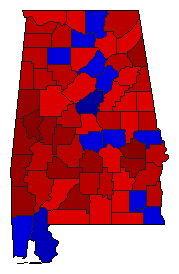
 | | 2014 |
1,140,942 |
2 |
1 |
0 |
326,925 |
28.65% |
35.62% |
64.27% |
0.00% |
0.11% |
406,373 |
733,298 |
0 |
1,271 |
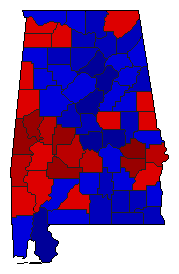
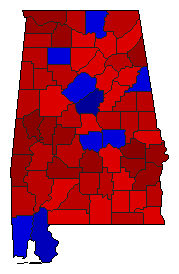
 | | 2010 |
1,450,152 |
2 |
1 |
0 |
357,890 |
24.68% |
37.66% |
62.34% |
0.00% |
0.00% |
546,131 |
904,021 |
0 |
0 |
 | | 2006 |
1,204,136 |
2 |
1 |
0 |
183,537 |
15.24% |
42.34% |
57.58% |
0.00% |
0.08% |
509,797 |
693,334 |
0 |
1,005 |
 | | 2002 |
1,290,280 |
1 |
2 |
0 |
1,989 |
0.15% |
49.05% |
48.89% |
0.00% |
2.06% |
632,852 |
630,863 |
0 |
26,565 |
 | | 1998 |
1,233,566 |
2 |
1 |
0 |
10,528 |
0.85% |
49.57% |
50.43% |
0.00% |
0.00% |
611,519 |
622,047 |
0 |
0 |
 | | 1994 |
1,072,919 |
1 |
2 |
0 |
71,815 |
6.69% |
53.35% |
46.65% |
0.00% |
0.00% |
572,367 |
500,552 |
0 |
0 |
 | | 1990 |
1,103,798 |
1 |
2 |
0 |
115,504 |
10.46% |
55.23% |
44.77% |
0.00% |
0.00% |
609,651 |
494,147 |
0 |
0 |
 | | 1986 |
1,046,681 |
1 |
2 |
0 |
236,303 |
22.58% |
61.29% |
38.71% |
0.00% |
0.00% |
641,492 |
405,189 |
0 |
0 |
 | | 1970 |
701,737 |
1 |
0 |
2 |
500,685 |
71.35% |
85.67% |
0.00% |
14.33% |
0.00% |
601,211 |
0 |
100,526 |
0 |
|
