| Map | Pie | Office | Total | D | R | I | Margin | %Margin | Dem | Rep | Ind | Oth. | Dem | Rep | Ind | Other | | | | | | | | | | | | | | | | | | |
|---|
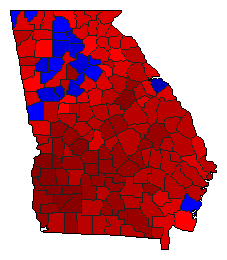
 |  | Senator |
1,753,953 |
2 |
1 |
0 |
126,636 |
7.22% |
45.15% |
52.37% |
0.00% |
2.48% |
791,904 |
918,540 |
0 |
43,509 |
 |  | Governor |
1,792,882 |
1 |
2 |
0 |
150,875 |
8.42% |
52.49% |
44.07% |
0.00% |
3.44% |
941,076 |
790,201 |
0 |
61,605 |
 | | Lt. Governor |
1,757,691 |
1 |
2 |
0 |
314,096 |
17.87% |
56.35% |
38.48% |
0.00% |
5.17% |
990,454 |
676,358 |
0 |
90,879 |
 | | Secretary of State |
1,738,127 |
1 |
2 |
0 |
279,964 |
16.11% |
56.61% |
40.50% |
0.00% |
2.89% |
983,905 |
703,941 |
0 |
50,281 |
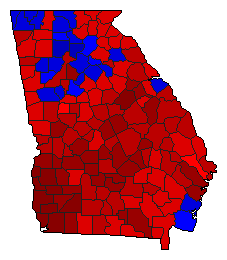
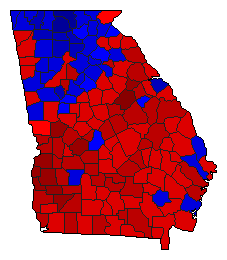 | | Attorney General |
1,737,086 |
1 |
2 |
0 |
97,263 |
5.60% |
50.89% |
45.29% |
0.00% |
3.83% |
883,932 |
786,669 |
0 |
66,485 |
 | | Insurance Commissioner |
1,728,663 |
2 |
1 |
0 |
365,711 |
21.16% |
37.71% |
58.87% |
0.00% |
3.42% |
651,891 |
1,017,602 |
0 |
59,170 |
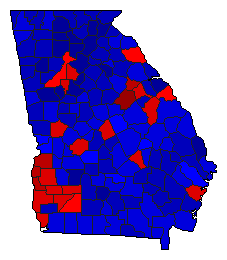
 | | Agriculture Commissioner |
1,728,679 |
1 |
2 |
3 |
500,030 |
28.93% |
62.80% |
33.88% |
3.32% |
0.00% |
1,085,694 |
585,664 |
57,321 |
0 |
|
