| Map | Pie | Office | Total | D | R | I | Margin | %Margin | Dem | Rep | Ind | Oth. | Dem | Rep | Ind | Other | | | | | | | | | | | | | | | | | | |
|---|
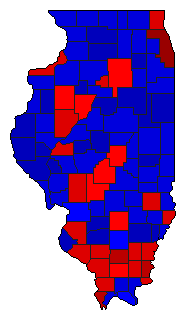
 |  | Senator |
3,394,521 |
2 |
1 |
0 |
98,545 |
2.90% |
47.44% |
50.35% |
0.00% |
2.21% |
1,610,496 |
1,709,041 |
0 |
74,984 |
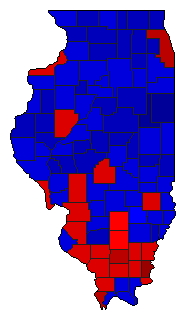
 |  | Governor |
3,358,657 |
2 |
1 |
3 |
119,903 |
3.57% |
47.47% |
51.04% |
1.50% |
0.00% |
1,594,191 |
1,714,094 |
50,372 |
0 |
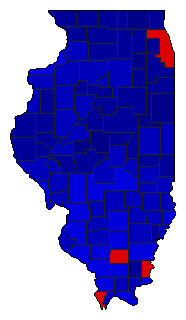
 | | Secretary of State |
3,379,971 |
1 |
2 |
4 |
437,206 |
12.94% |
55.46% |
42.53% |
0.01% |
2.00% |
1,874,626 |
1,437,420 |
229 |
67,696 |
 | | State Treasurer |
3,222,944 |
2 |
1 |
3 |
62,279 |
1.93% |
48.04% |
49.97% |
1.99% |
0.01% |
1,548,219 |
1,610,498 |
64,001 |
226 |
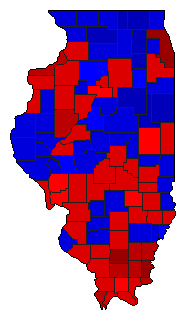
 | | Attorney General |
3,326,704 |
2 |
1 |
0 |
783,802 |
23.56% |
37.36% |
60.92% |
0.00% |
1.71% |
1,242,979 |
2,026,781 |
0 |
56,944 |
 | | Comptroller General |
3,232,352 |
1 |
2 |
3 |
614,413 |
19.01% |
58.63% |
39.63% |
1.74% |
0.00% |
1,895,273 |
1,280,860 |
56,219 |
0 |
|
