1998 General Election Results Comparison - Massachusetts
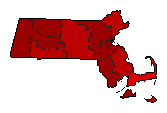
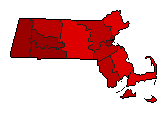
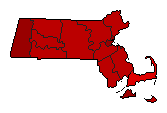
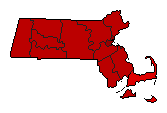
| Map | Pie | Office | Total | D | R | I | Margin | %Margin | Dem | Rep | Ind | Oth. | Dem | Rep | Ind | Other |
| Governor | 1,903,336 | 2 | 1 | 0 | 65,317 | 3.43% | 47.38% | 50.81% | 0.00% | 1.80% | 901,843 | 967,160 | 0 | 34,333 | ||
 | Secretary of State | 1,791,664 | 1 | 2 | 0 | 801,356 | 44.73% | 69.93% | 25.20% | 0.00% | 4.87% | 1,252,912 | 451,556 | 0 | 87,196 | |
 | State Treasurer | 1,801,017 | 1 | 2 | 0 | 494,471 | 27.46% | 62.23% | 34.77% | 0.00% | 3.00% | 1,120,757 | 626,286 | 0 | 53,974 | |
 | Attorney General | 1,824,543 | 1 | 2 | 0 | 613,544 | 33.63% | 66.77% | 33.14% | 0.00% | 0.09% | 1,218,244 | 604,700 | 0 | 1,599 | |
 | State Auditor | 1,788,998 | 1 | 2 | 0 | 623,466 | 34.85% | 64.55% | 29.70% | 0.00% | 5.75% | 1,154,829 | 531,363 | 0 | 102,806 |
Massachusetts Results for 1998
Login
© Dave Leip's Atlas of U.S. Elections, LLC 2019 All Rights Reserved
Note: The advertisement links below may advocate political positions that this site does not endorse.
Login
© Dave Leip's Atlas of U.S. Elections, LLC 2019 All Rights Reserved
Note: The advertisement links below may advocate political positions that this site does not endorse.