| Map | Pie | Office | Total | D | R | I | Margin | %Margin | Dem | Rep | Ind | Oth. | Dem | Rep | Ind | Other | | | | | | | | | | | | | | | | | | |
|---|
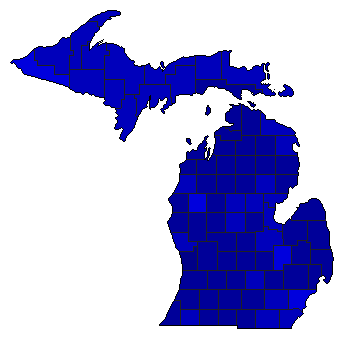
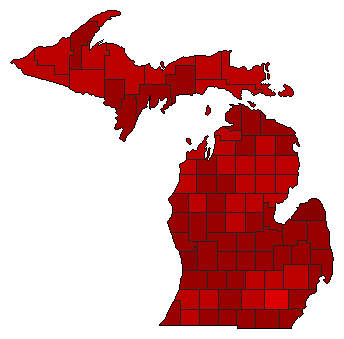
 |  | Governor |
3,027,104 |
2 |
1 |
0 |
739,431 |
24.43% |
37.78% |
62.20% |
0.00% |
0.02% |
1,143,574 |
1,883,005 |
0 |
525 |
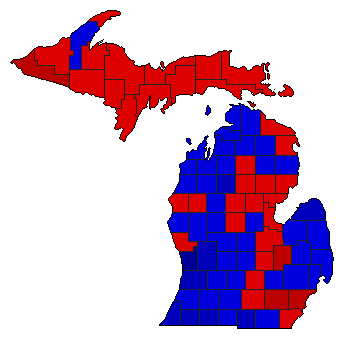
 | | Secretary of State |
3,016,886 |
2 |
1 |
3 |
1,116,875 |
37.02% |
31.11% |
68.13% |
0.76% |
0.00% |
938,557 |
2,055,432 |
22,897 |
0 |
 | | Attorney General |
2,989,914 |
1 |
2 |
0 |
124,706 |
4.17% |
52.09% |
47.91% |
0.00% |
0.00% |
1,557,310 |
1,432,604 |
0 |
0 |
| | | Map | Pie | Initiative | Total Vote | N | | Y | Margin | %Margin | No | | Yes | Oth. | No | | Yes | |
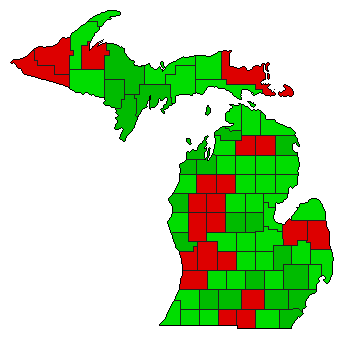 | | Referendum |
2,889,860 |
2 |
0 |
1 |
525,714 |
18.19% |
40.90% |
0.00% |
59.10% |
0.00% |
1,182,073 |
0 |
1,707,787 |
0 |
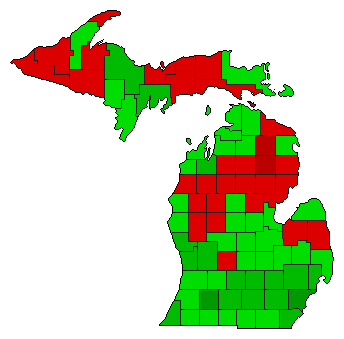 |  | Referendum |
2,902,994 |
2 |
0 |
1 |
739,018 |
25.46% |
37.27% |
0.00% |
62.73% |
0.00% |
1,081,988 |
0 |
1,821,006 |
0 |
 | | Initiative |
2,975,535 |
1 |
0 |
2 |
1,256,773 |
42.24% |
71.12% |
0.00% |
28.88% |
0.00% |
2,116,154 |
0 |
859,381 |
0 |
|
