| Map | Pie | Office | Total | D | R | I | Margin | %Margin | Dem | Rep | Ind | Oth. | Dem | Rep | Ind | Other | | | | | | | | | | | | | | | | | | |
|---|
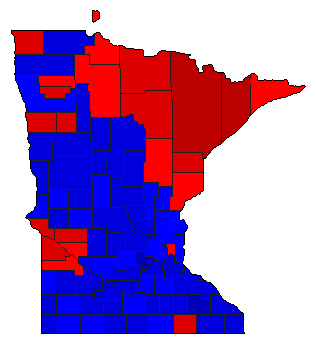
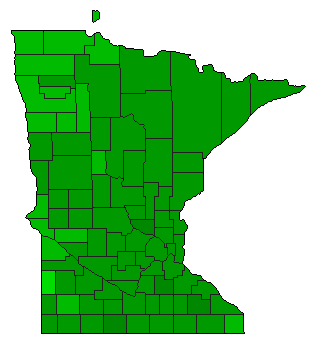
 |  | Governor |
2,091,766 |
3 |
2 |
1 |
56,363 |
2.69% |
28.09% |
34.29% |
36.99% |
0.63% |
587,528 |
717,350 |
773,713 |
13,175 |
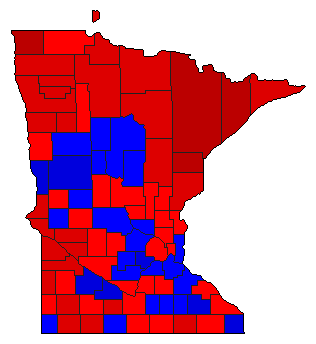
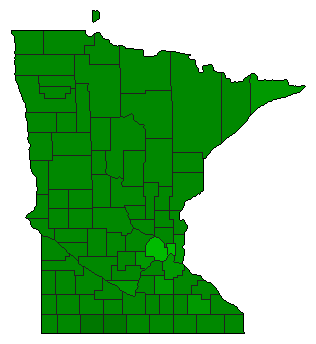
 | | Secretary of State |
1,938,661 |
2 |
1 |
3 |
110,549 |
5.70% |
42.17% |
47.88% |
9.95% |
0.00% |
817,607 |
928,156 |
192,898 |
0 |
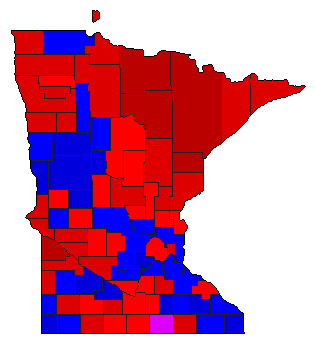
 |  | State Treasurer |
1,954,055 |
1 |
2 |
0 |
95,311 |
4.88% |
45.39% |
40.52% |
0.00% |
14.09% |
887,025 |
791,714 |
0 |
275,316 |
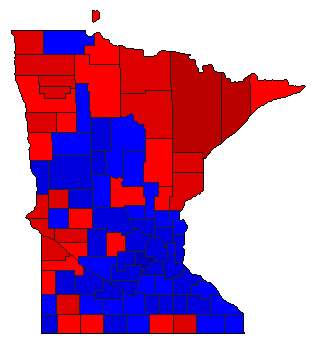
 |  | Attorney General |
2,007,323 |
1 |
2 |
0 |
80,184 |
3.99% |
47.83% |
43.83% |
0.00% |
8.34% |
960,048 |
879,864 |
0 |
167,411 |
 |  | State Auditor |
1,972,189 |
2 |
1 |
0 |
155,243 |
7.87% |
41.19% |
49.06% |
0.00% |
9.75% |
812,347 |
967,590 |
0 |
192,252 |
| | | Map | Pie | Initiative | Total Vote | N | | Y | Margin | %Margin | No | | Yes | Oth. | No | | Yes | |
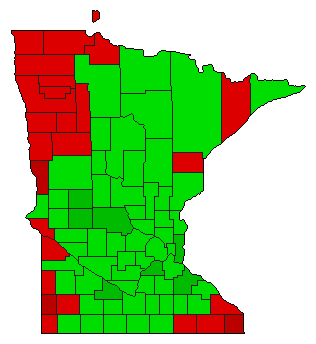
 |  | Amendment |
2,017,642 |
2 |
0 |
1 |
1,096,148 |
54.33% |
22.84% |
0.00% |
77.16% |
0.00% |
460,747 |
0 |
1,556,895 |
0 |
 |  | Amendment |
2,033,469 |
2 |
0 |
1 |
1,107,971 |
54.49% |
22.76% |
0.00% |
77.24% |
0.00% |
462,749 |
0 |
1,570,720 |
0 |
 |  | Amendment |
1,943,642 |
2 |
0 |
1 |
231,936 |
11.93% |
44.03% |
0.00% |
55.97% |
0.00% |
855,853 |
0 |
1,087,789 |
0 |
|
