Note: The Google advertisement links below may advocate political positions that this site does not endorse.
| Map | Pie | Office | Total | D | R | I | Margin | %Margin | Dem | Rep | Ind | Oth. | Dem | Rep | Ind | Other | | | | | | | | | | | | | | | | | | |
|---|
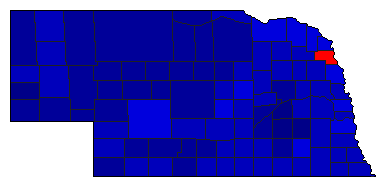
 |  | Governor |
545,238 |
2 |
1 |
0 |
43,232 |
7.93% |
45.98% |
53.90% |
0.00% |
0.12% |
250,678 |
293,910 |
0 |
650 |
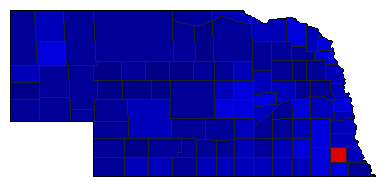
 |  | Secretary of State |
501,390 |
2 |
1 |
0 |
182,583 |
36.42% |
28.16% |
64.57% |
0.00% |
7.27% |
141,183 |
323,766 |
0 |
36,441 |
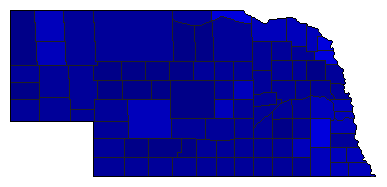
 |  | State Treasurer |
490,341 |
2 |
1 |
0 |
148,119 |
30.21% |
33.19% |
63.40% |
0.00% |
3.41% |
162,762 |
310,881 |
0 |
16,698 |
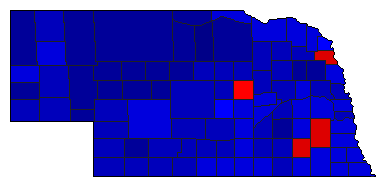
 |  | Attorney General |
519,939 |
2 |
1 |
0 |
202,885 |
39.02% |
29.05% |
68.07% |
0.00% |
2.87% |
151,054 |
353,939 |
0 |
14,946 |
 |  | State Auditor |
493,894 |
2 |
1 |
0 |
101,203 |
20.49% |
37.81% |
58.30% |
0.00% |
3.90% |
186,717 |
287,920 |
0 |
19,257 |
|
