| Map | Pie | Office | Total | D | R | I | Margin | %Margin | Dem | Rep | Ind | Oth. | Dem | Rep | Ind | Other | | | | | | | | | | | | | | | | | | |
|---|
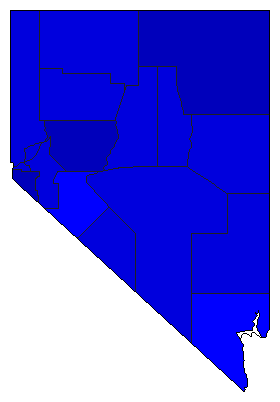
 |  | Senator |
435,790 |
1 |
2 |
0 |
428 |
0.10% |
47.88% |
47.78% |
0.00% |
4.34% |
208,650 |
208,222 |
0 |
18,918 |
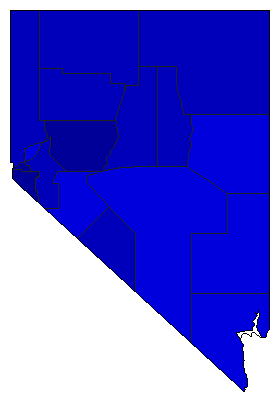
 |  | Governor |
433,630 |
2 |
1 |
0 |
41,611 |
9.60% |
42.04% |
51.63% |
0.00% |
6.33% |
182,281 |
223,892 |
0 |
27,457 |
 | | Lt. Governor |
426,913 |
2 |
1 |
0 |
48,065 |
11.26% |
39.05% |
50.31% |
0.00% |
10.64% |
166,716 |
214,781 |
0 |
45,416 |
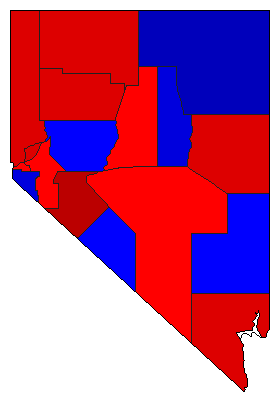
 | | Secretary of State |
411,558 |
0 |
1 |
3 |
218,261 |
53.03% |
0.00% |
65.61% |
10.42% |
23.97% |
0 |
270,024 |
42,893 |
98,641 |
 | | State Treasurer |
401,900 |
0 |
1 |
2 |
176,752 |
43.98% |
0.00% |
62.10% |
18.12% |
19.77% |
0 |
249,594 |
72,842 |
79,464 |
 | | Attorney General |
416,919 |
1 |
2 |
0 |
28,082 |
6.74% |
50.51% |
43.77% |
0.00% |
5.72% |
210,571 |
182,489 |
0 |
23,859 |
 | | Controller |
416,067 |
2 |
1 |
0 |
20,916 |
5.03% |
41.60% |
46.63% |
0.00% |
11.76% |
173,101 |
194,017 |
0 |
48,949 |
| | | Map | Pie | Initiative | Total Vote | N | | Y | Margin | %Margin | No | | Yes | Oth. | No | | Yes | |
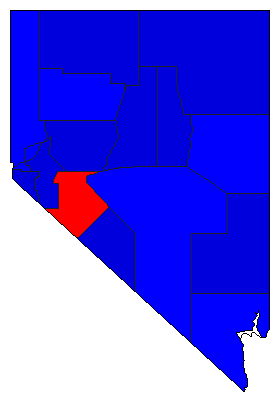
 | | Referendum |
411,774 |
2 |
0 |
1 |
71,246 |
17.30% |
41.35% |
0.00% |
58.65% |
0.00% |
170,264 |
0 |
241,510 |
0 |
|
