| Map | Pie | Office | Total | D | R | I | Margin | %Margin | Dem | Rep | Ind | Oth. | Dem | Rep | Ind | Other | | | | | | | | | | | | | | | | | | |
|---|
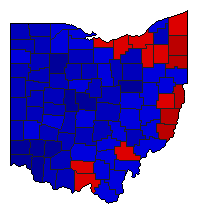
 |  | Senator |
3,404,351 |
2 |
1 |
0 |
440,033 |
12.93% |
43.53% |
56.46% |
0.00% |
0.01% |
1,482,054 |
1,922,087 |
0 |
210 |
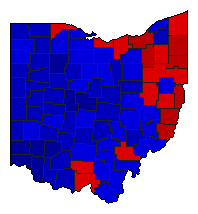
 |  | Governor |
3,354,213 |
2 |
1 |
3 |
179,765 |
5.36% |
44.69% |
50.05% |
3.32% |
1.94% |
1,498,956 |
1,678,721 |
111,468 |
65,068 |
 | | Secretary of State |
3,193,372 |
2 |
1 |
0 |
385,024 |
12.06% |
43.97% |
56.03% |
0.00% |
0.01% |
1,404,081 |
1,789,105 |
0 |
186 |
 |  | State Treasurer |
3,192,083 |
2 |
1 |
0 |
246,203 |
7.71% |
46.14% |
53.86% |
0.00% |
0.00% |
1,472,940 |
1,719,143 |
0 |
0 |
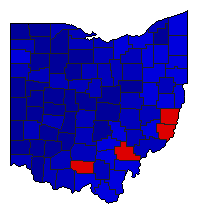 | | Attorney General |
3,277,966 |
2 |
1 |
0 |
797,762 |
24.34% |
37.83% |
62.17% |
0.00% |
0.00% |
1,240,102 |
2,037,864 |
0 |
0 |
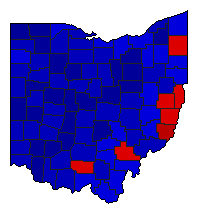 | | State Auditor |
3,167,043 |
2 |
1 |
0 |
784,543 |
24.77% |
37.61% |
62.39% |
0.00% |
0.00% |
1,191,250 |
1,975,793 |
0 |
0 |
| | | Map | Pie | Initiative | Total Vote | N | | Y | Margin | %Margin | No | | Yes | Oth. | No | | Yes | |
 |  | Initiative |
3,325,514 |
1 |
0 |
2 |
628,448 |
18.90% |
59.45% |
0.00% |
40.55% |
0.00% |
1,976,981 |
0 |
1,348,533 |
0 |
|
