| Map | Pie | Office | Total | D | R | I | Margin | %Margin | Dem | Rep | Ind | Oth. | Dem | Rep | Ind | Other | | | | | | | | | | | | | | | | | | |
|---|
 |  | Senator |
1,013,280 |
2 |
1 |
0 |
421,353 |
41.58% |
27.16% |
68.74% |
0.00% |
4.09% |
275,224 |
696,577 |
0 |
41,479 |
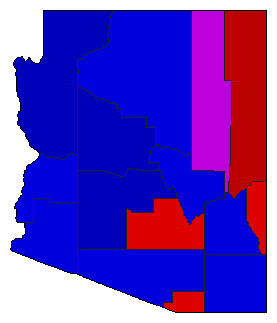
 |  | Governor |
1,017,616 |
2 |
1 |
4 |
258,636 |
25.42% |
35.53% |
60.95% |
0.82% |
2.70% |
361,552 |
620,188 |
8,371 |
27,505 |
 | | Secretary of State |
992,711 |
2 |
1 |
0 |
162,737 |
16.39% |
41.80% |
58.20% |
0.00% |
0.00% |
414,987 |
577,724 |
0 |
0 |
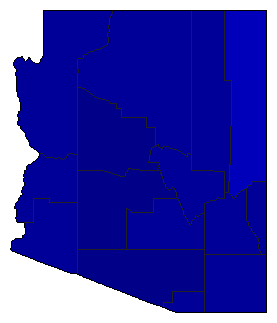 | | State Treasurer |
886,508 |
0 |
1 |
0 |
542,970 |
61.25% |
0.00% |
80.62% |
0.00% |
19.38% |
0 |
714,739 |
0 |
171,769 |
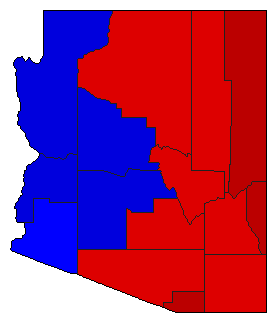 | | Attorney General |
1,010,779 |
1 |
2 |
0 |
29,731 |
2.94% |
50.41% |
47.47% |
0.00% |
2.12% |
509,516 |
479,785 |
0 |
21,478 |
| | | Map | Pie | Initiative | Total Vote | N | | Y | Margin | %Margin | No | | Yes | Oth. | No | | Yes | |
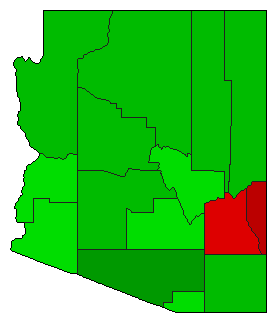 | | Initiative |
978,426 |
2 |
0 |
1 |
353,690 |
36.15% |
31.93% |
0.00% |
68.07% |
0.00% |
312,368 |
0 |
666,058 |
0 |
 | | Initiative |
909,029 |
1 |
0 |
2 |
90,763 |
9.98% |
54.99% |
0.00% |
45.01% |
0.00% |
499,896 |
0 |
409,133 |
0 |
|
