| Map | Pie | Year | Total | D | R | I | Margin | %Margin | Dem | Rep | Ind | Oth. | Dem | Rep | Ind | Other | | | | | | | | | | | | | | | | | | |
|---|
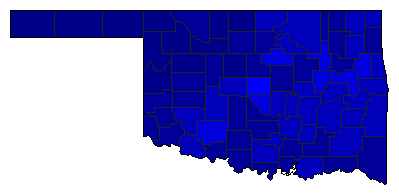
|  | 2022 |
1,146,992 |
2 |
1 |
0 |
388,240 |
33.85% |
31.02% |
64.87% |
0.00% |
4.12% |
355,763 |
744,003 |
0 |
47,226 |
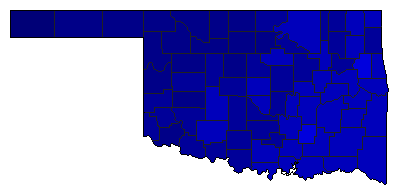
 |  | 2018 |
1,178,190 |
2 |
1 |
3 |
322,422 |
27.37% |
34.53% |
61.89% |
3.58% |
0.00% |
406,797 |
729,219 |
42,174 |
0 |
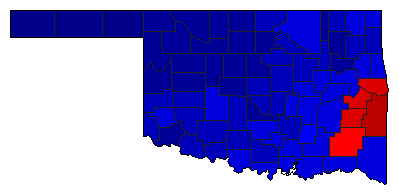
 | | 2014 |
820,652 |
2 |
1 |
0 |
303,524 |
36.99% |
31.51% |
68.49% |
0.00% |
0.00% |
258,564 |
562,088 |
0 |
0 |
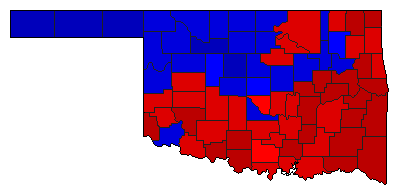
 | | 2010 |
1,029,618 |
2 |
1 |
3 |
324,531 |
31.52% |
32.51% |
64.03% |
3.46% |
0.00% |
334,711 |
659,242 |
35,665 |
0 |
 | | 2006 |
924,855 |
1 |
2 |
3 |
24,335 |
2.63% |
50.14% |
47.51% |
2.34% |
0.00% |
463,753 |
439,418 |
21,684 |
0 |
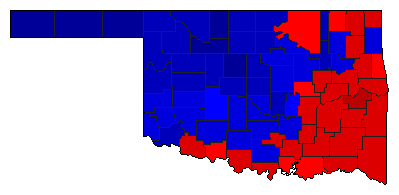 | | 2002 |
1,028,356 |
2 |
1 |
0 |
184,479 |
17.94% |
38.95% |
56.89% |
0.00% |
4.17% |
400,511 |
584,990 |
0 |
42,855 |
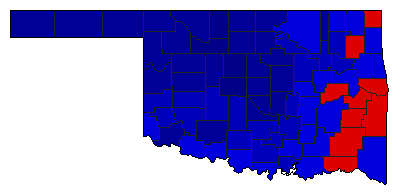 | | 1998 |
867,091 |
2 |
1 |
0 |
304,333 |
35.10% |
32.45% |
67.55% |
0.00% |
0.00% |
281,379 |
585,712 |
0 |
0 |
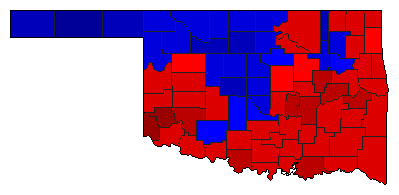 | | 1994 |
985,138 |
2 |
1 |
3 |
54,324 |
5.51% |
44.18% |
49.69% |
6.13% |
0.00% |
435,215 |
489,539 |
60,384 |
0 |
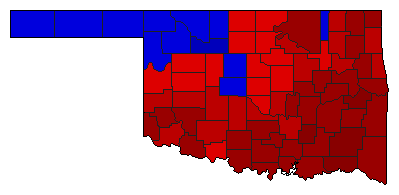 | | 1990 |
883,608 |
1 |
2 |
0 |
191,946 |
21.72% |
60.86% |
39.14% |
0.00% |
0.00% |
537,777 |
345,831 |
0 |
0 |
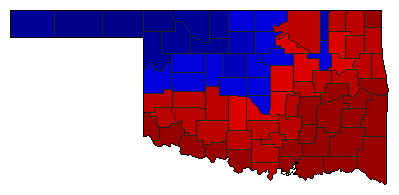 | | 1986 |
895,321 |
1 |
2 |
0 |
44,241 |
4.94% |
52.47% |
47.53% |
0.00% |
0.00% |
469,781 |
425,540 |
0 |
0 |
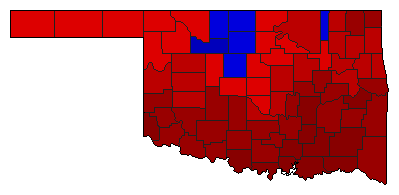 | | 1982 |
834,037 |
1 |
2 |
0 |
191,507 |
22.96% |
61.48% |
38.52% |
0.00% |
0.00% |
512,772 |
321,265 |
0 |
0 |
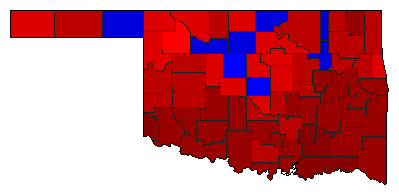 | | 1978 |
714,869 |
1 |
2 |
3 |
129,569 |
18.12% |
57.83% |
39.71% |
2.46% |
0.00% |
413,429 |
283,860 |
17,580 |
0 |
|