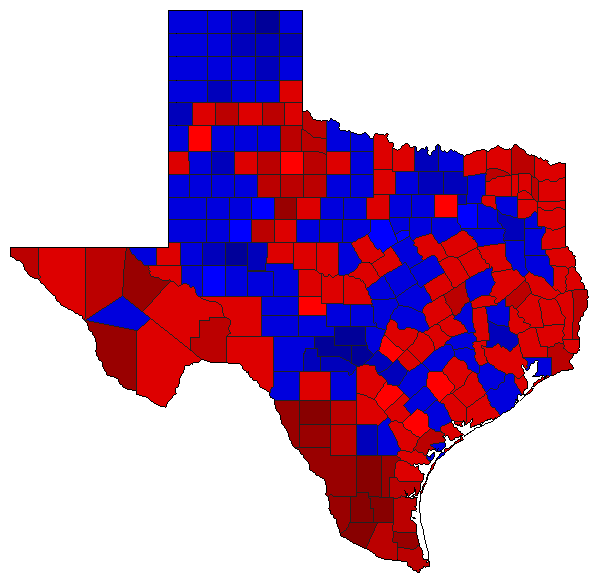
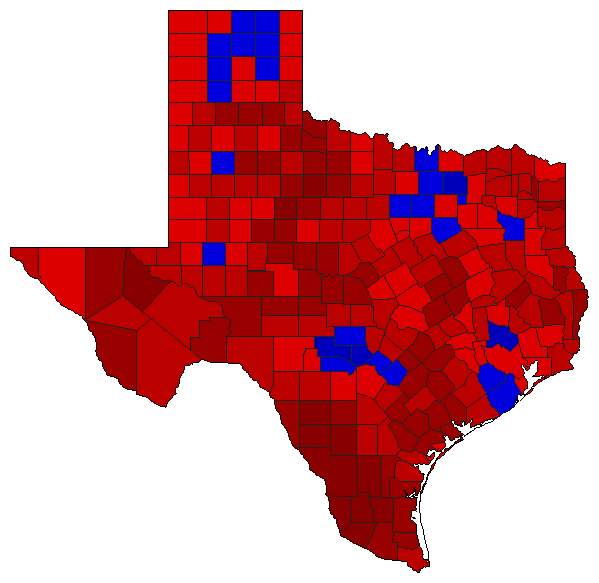
| Map | Pie | Year | Total | D | R | I | Margin | %Margin | Dem | Rep | Ind | Oth. | Dem | Rep | Ind | Other | | | | | | | | | | | | | | | | | | |
|---|
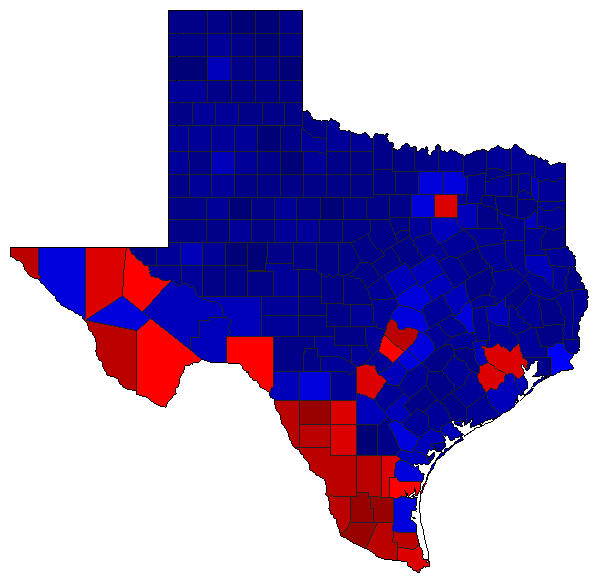
|  | 2022 |
7,973,593 |
2 |
1 |
0 |
1,231,250 |
15.44% |
40.95% |
56.39% |
0.00% |
2.66% |
3,265,069 |
4,496,319 |
0 |
212,205 |
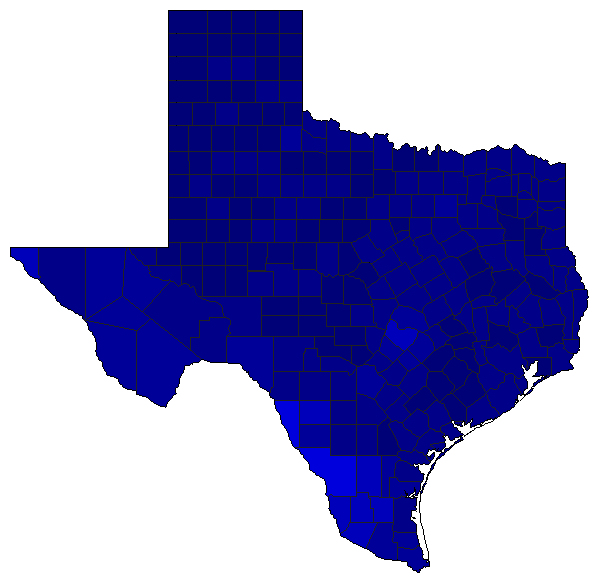
 |  | 2018 |
8,228,602 |
2 |
1 |
0 |
806,135 |
9.80% |
43.39% |
53.19% |
0.00% |
3.42% |
3,570,693 |
4,376,828 |
0 |
281,081 |
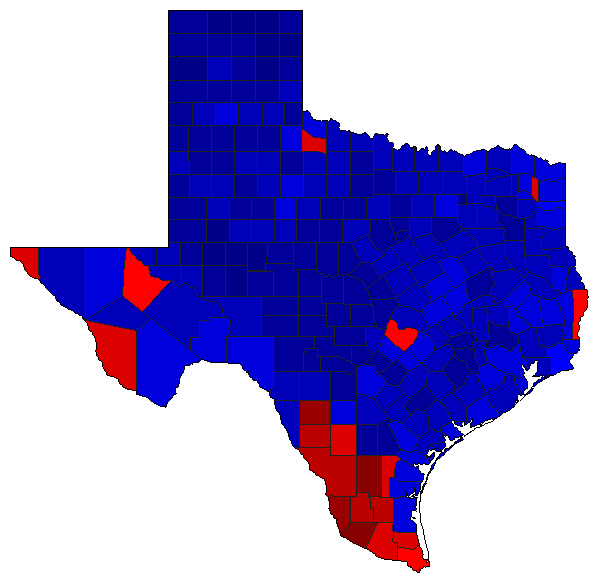
 |  | 2014 |
4,621,846 |
2 |
1 |
0 |
955,758 |
20.68% |
37.69% |
58.37% |
0.00% |
3.93% |
1,742,119 |
2,697,877 |
0 |
181,850 |
 | | 2010 |
3,977,691 |
0 |
1 |
0 |
2,890,412 |
72.67% |
0.00% |
83.16% |
0.00% |
16.84% |
0 |
3,307,935 |
0 |
669,756 |
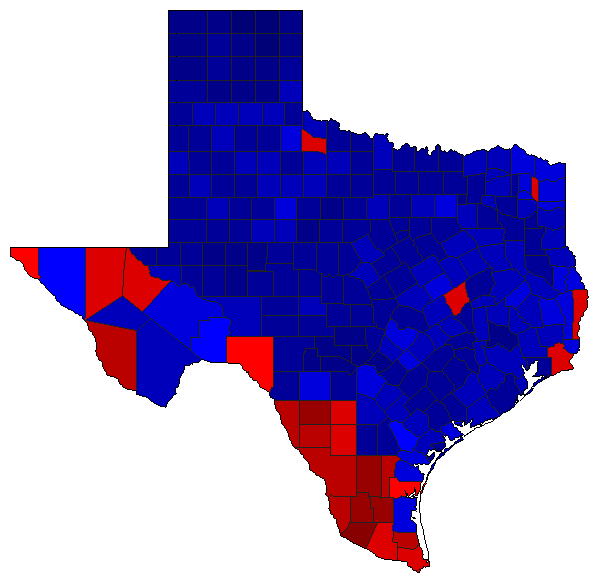
 | | 2006 |
4,283,250 |
2 |
1 |
0 |
961,961 |
22.46% |
37.01% |
59.47% |
0.00% |
3.52% |
1,585,362 |
2,547,323 |
0 |
150,565 |
 | | 2002 |
4,486,499 |
2 |
1 |
0 |
1,401,756 |
31.24% |
32.92% |
64.16% |
0.00% |
2.92% |
1,476,976 |
2,878,732 |
0 |
130,791 |
 | | 1998 |
3,675,775 |
2 |
1 |
0 |
20,223 |
0.55% |
49.00% |
49.55% |
0.00% |
1.46% |
1,801,008 |
1,821,231 |
0 |
53,536 |
 | | 1994 |
4,178,615 |
1 |
2 |
0 |
458,075 |
10.96% |
55.48% |
44.52% |
0.00% |
0.00% |
2,318,345 |
1,860,270 |
0 |
0 |
|
