| Map | Pie | Year | Total | D | R | I | Margin | %Margin | Dem | Rep | Ind | Oth. | Dem | Rep | Ind | Other | | | | | | | | | | | | | | | | | | |
|---|
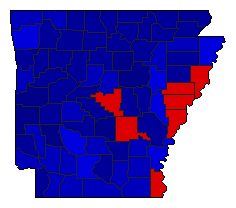
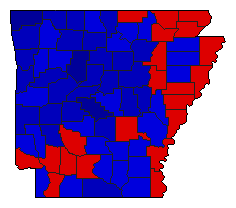
|  | 2022 |
899,110 |
2 |
1 |
0 |
288,685 |
32.11% |
32.10% |
64.21% |
0.00% |
3.69% |
288,631 |
577,316 |
0 |
33,163 |
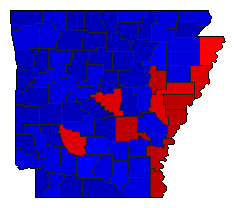
 |  | 2018 |
888,735 |
2 |
1 |
0 |
276,898 |
31.16% |
33.03% |
64.18% |
0.00% |
2.79% |
293,535 |
570,433 |
0 |
24,767 |
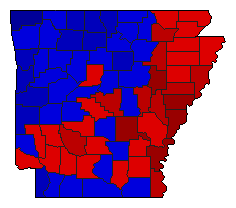
 | | 2014 |
837,377 |
2 |
1 |
0 |
155,113 |
18.52% |
38.64% |
57.16% |
0.00% |
4.20% |
323,548 |
478,661 |
0 |
35,168 |
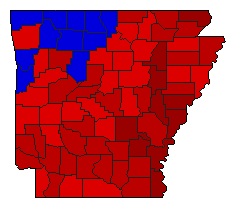
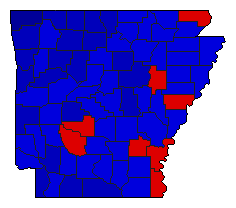
 | | 2010 |
763,281 |
2 |
1 |
0 |
16,099 |
2.11% |
48.95% |
51.05% |
0.00% |
0.00% |
373,591 |
389,690 |
0 |
0 |
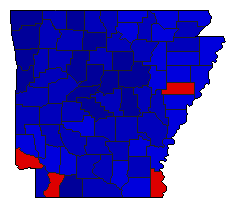
 | | 2006 |
762,705 |
1 |
2 |
0 |
112,275 |
14.72% |
57.36% |
42.64% |
0.00% |
0.00% |
437,490 |
325,215 |
0 |
0 |
 | | 2002 |
795,654 |
2 |
1 |
0 |
158,470 |
19.92% |
40.04% |
59.96% |
0.00% |
0.00% |
318,592 |
477,062 |
0 |
0 |
 | | 1998 |
692,160 |
2 |
1 |
0 |
230,700 |
33.33% |
33.33% |
66.67% |
0.00% |
0.00% |
230,730 |
461,430 |
0 |
0 |
 | | 1994 |
712,148 |
2 |
1 |
0 |
122,234 |
17.16% |
41.42% |
58.58% |
0.00% |
0.00% |
294,957 |
417,191 |
0 |
0 |
|
