| Map | Pie | Office | Total | D | R | I | Margin | %Margin | Dem | Rep | Ind | Oth. | Dem | Rep | Ind | Other | | | | | | | | | | | | | | | | | | |
|---|
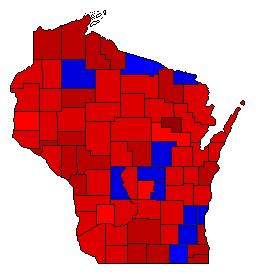
 |  | Senator |
1,760,836 |
1 |
2 |
5 |
37,787 |
2.15% |
50.55% |
48.40% |
0.24% |
0.81% |
890,059 |
852,272 |
4,266 |
14,239 |
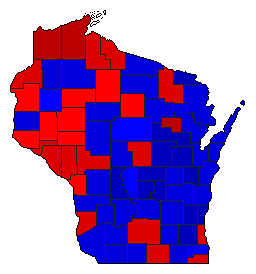
 |  | Governor |
1,756,014 |
2 |
1 |
0 |
368,163 |
20.97% |
38.70% |
59.66% |
0.00% |
1.64% |
679,553 |
1,047,716 |
0 |
28,745 |
 |  | Secretary of State |
1,679,484 |
1 |
2 |
0 |
313,338 |
18.66% |
57.98% |
39.32% |
0.00% |
2.70% |
973,744 |
660,406 |
0 |
45,334 |
 |  | State Treasurer |
1,628,741 |
2 |
1 |
0 |
60,203 |
3.70% |
46.30% |
50.00% |
0.00% |
3.70% |
754,177 |
814,380 |
0 |
60,184 |
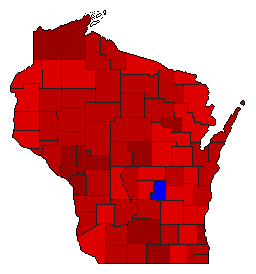 |  | Attorney General |
1,713,033 |
1 |
2 |
0 |
546,700 |
31.91% |
64.90% |
32.99% |
0.00% |
2.11% |
1,111,773 |
565,073 |
0 |
36,187 |
| | | Map | Pie | Initiative | Total Vote | N | | Y | Margin | %Margin | No | | Yes | Oth. | No | | Yes | |
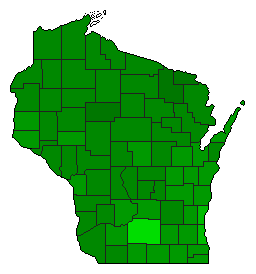 | | Referendum |
1,630,925 |
2 |
0 |
1 |
780,821 |
47.88% |
26.06% |
0.00% |
73.94% |
0.00% |
425,052 |
0 |
1,205,873 |
0 |
|
