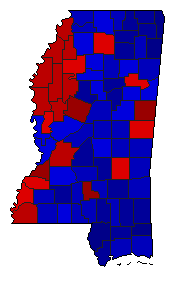
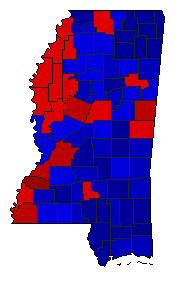
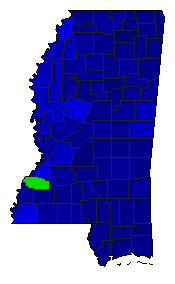
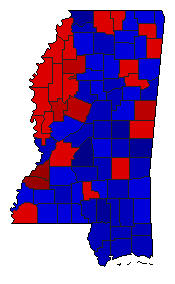
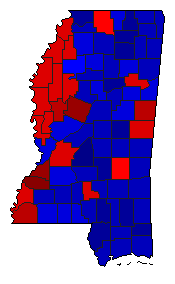
Lt. Gubernatorial General Election Results Comparison - Mississippi
Note: The Google advertisement links below may advocate political positions that this site does not endorse.
MapPieYearTotalDRIMargin%MarginDemRepIndOth.DemRepIndOther 
                 
MapMap2019 874,384 2 1 0 175,130 20.03% 39.99% 60.01% 0.00% 0.00% 349,627 524,757 0 0
MapMap2015 711,283 2 1 3 174,333 24.51% 35.94% 60.45% 2.28% 1.32% 255,657 429,990 16,226 9,410
Map2011 801,626 0 1 2 486,332 60.67% 0.00% 80.33% 19.67% 0.00% 0 643,979 157,647 0
Map2007 737,156 2 1 0 126,338 17.14% 41.43% 58.57% 0.00% 0.00% 305,409 431,747 0 0
Map2003 889,064 2 1 3 212,675 23.92% 37.06% 60.98% 1.97% 0.00% 329,454 542,129 17,481 0
Map1999 754,818 1 2 0 43,316 5.74% 52.87% 47.13% 0.00% 0.00% 399,067 355,751 0 0

Mississippi Results for 1999

Login

Terms of Use - DCMA Policy - Privacy Policy and Cookies


© Dave Leip's Atlas of U.S. Elections, LLC 2019 All Rights Reserved