| Map | Pie | Office | Total | D | R | I | Margin | %Margin | Dem | Rep | Ind | Oth. | Dem | Rep | Ind | Other | | | | | | | | | | | | | | | | | | |
|---|
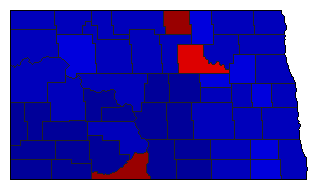
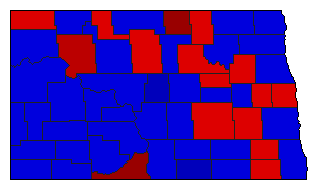
 |  | President |
288,267 |
2 |
1 |
3 |
79,568 |
27.60% |
33.05% |
60.66% |
3.29% |
3.00% |
95,284 |
174,852 |
9,497 |
8,634 |
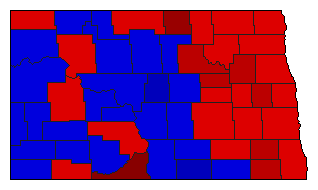
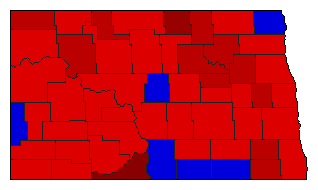
 |  | Senator |
287,539 |
1 |
2 |
0 |
65,401 |
22.75% |
61.37% |
38.63% |
0.00% |
0.00% |
176,470 |
111,069 |
0 |
0 |
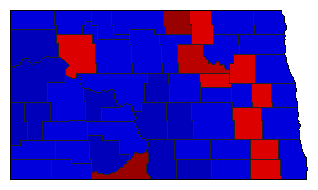
 |  | Governor |
289,412 |
2 |
1 |
0 |
29,111 |
10.06% |
44.97% |
55.03% |
0.00% |
0.00% |
130,144 |
159,255 |
0 |
13 |
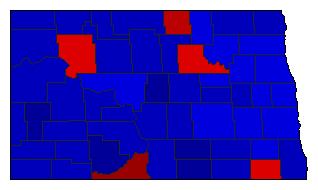
 | | Secretary of State |
272,974 |
2 |
1 |
0 |
84,926 |
31.11% |
34.44% |
65.56% |
0.00% |
0.00% |
94,024 |
178,950 |
0 |
0 |
 | | State Treasurer |
273,025 |
1 |
2 |
0 |
4,051 |
1.48% |
50.74% |
49.26% |
0.00% |
0.00% |
138,538 |
134,487 |
0 |
0 |
 | | Attorney General |
283,452 |
2 |
1 |
0 |
32,520 |
11.47% |
44.26% |
55.74% |
0.00% |
0.00% |
125,466 |
157,986 |
0 |
0 |
 | | State Auditor |
272,531 |
2 |
1 |
0 |
57,521 |
21.11% |
39.45% |
60.55% |
0.00% |
0.00% |
107,505 |
165,026 |
0 |
0 |
 | | Insurance Commissioner |
272,208 |
2 |
1 |
0 |
17,762 |
6.53% |
46.74% |
53.26% |
0.00% |
0.00% |
127,223 |
144,985 |
0 |
0 |
 |  | Agriculture Commissioner |
273,467 |
1 |
2 |
0 |
27,859 |
10.19% |
55.09% |
44.91% |
0.00% |
0.00% |
150,663 |
122,804 |
0 |
0 |
|
