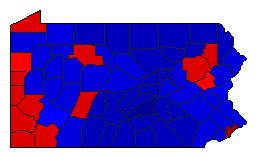
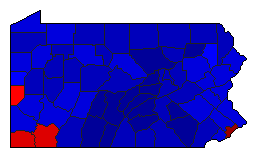
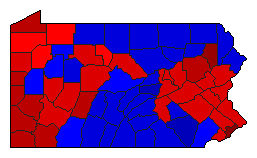
2000 General Election Results Comparison - Pennsylvania
| Map | Pie | Office | Total | D | R | I | Margin | %Margin | Dem | Rep | Ind | Oth. | Dem | Rep | Ind | Other |
 | President | 4,913,119 | 1 | 2 | 3 | 204,840 | 4.17% | 50.60% | 46.43% | 2.10% | 0.87% | 2,485,967 | 2,281,127 | 103,392 | 42,633 | |
 |  | Senator | 4,735,540 | 2 | 1 | 0 | 327,054 | 6.91% | 45.51% | 52.41% | 0.00% | 2.08% | 2,154,908 | 2,481,962 | 0 | 98,670 |
 | State Treasurer | 4,680,934 | 2 | 1 | 0 | 95,951 | 2.05% | 47.24% | 49.29% | 0.00% | 3.46% | 2,211,471 | 2,307,422 | 0 | 162,041 | |
 | Attorney General | 4,619,438 | 2 | 1 | 0 | 504,109 | 10.91% | 43.10% | 54.02% | 0.00% | 2.88% | 1,991,144 | 2,495,253 | 0 | 133,041 | |
 | State Auditor | 4,664,541 | 1 | 2 | 0 | 788,617 | 16.91% | 56.84% | 39.94% | 0.00% | 3.22% | 2,651,551 | 1,862,934 | 0 | 150,056 |
Pennsylvania Results for 2000
Login
© Dave Leip's Atlas of U.S. Elections, LLC 2019 All Rights Reserved
Note: The advertisement links below may advocate political positions that this site does not endorse.
Login
© Dave Leip's Atlas of U.S. Elections, LLC 2019 All Rights Reserved
Note: The advertisement links below may advocate political positions that this site does not endorse.