Referendum General Election Results Comparison - Virginia
| Map | Pie | Year | Total | D | R | I | Margin | %Margin | Dem | Rep | Ind | Oth. | Dem | Rep | Ind | Other |
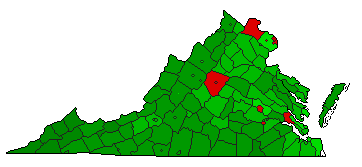 | 2000 | 2,418,423 | 2 | 0 | 1 | 477,885 | 19.76% | 40.12% | 0.00% | 59.88% | 0.00% | 970,269 | 0 | 1,448,154 | 0 |
Virginia Results for 2000
Login
© Dave Leip's Atlas of U.S. Elections, LLC 2019 All Rights Reserved
Note: The advertisement links below may advocate political positions that this site does not endorse.
Login
© Dave Leip's Atlas of U.S. Elections, LLC 2019 All Rights Reserved
Note: The advertisement links below may advocate political positions that this site does not endorse.