2000 General Election Results Comparison - West Virginia
| Map | Pie | Office | Total | D | R | I | Margin | %Margin | Dem | Rep | Ind | Oth. | Dem | Rep | Ind | Other |
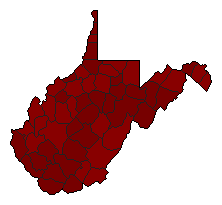
 |  | President | 648,124 | 2 | 1 | 3 | 40,978 | 6.32% | 45.59% | 51.92% | 1.65% | 0.84% | 295,497 | 336,475 | 10,680 | 5,472 |
 |  | Senator | 603,477 | 1 | 2 | 0 | 347,580 | 57.60% | 77.75% | 20.16% | 0.00% | 2.09% | 469,215 | 121,635 | 0 | 12,627 |
 |  | Governor | 648,047 | 1 | 2 | 0 | 18,896 | 2.92% | 50.12% | 47.21% | 0.00% | 2.67% | 324,822 | 305,926 | 0 | 17,299 |
 | Secretary of State | 534,966 | 1 | 0 | 0 | 422,012 | 78.89% | 89.44% | 0.00% | 0.00% | 10.56% | 478,489 | 0 | 0 | 56,477 |
West Virginia Results for 2000
Login
© Dave Leip's Atlas of U.S. Elections, LLC 2019 All Rights Reserved
Note: The advertisement links below may advocate political positions that this site does not endorse.
Login
© Dave Leip's Atlas of U.S. Elections, LLC 2019 All Rights Reserved
Note: The advertisement links below may advocate political positions that this site does not endorse.