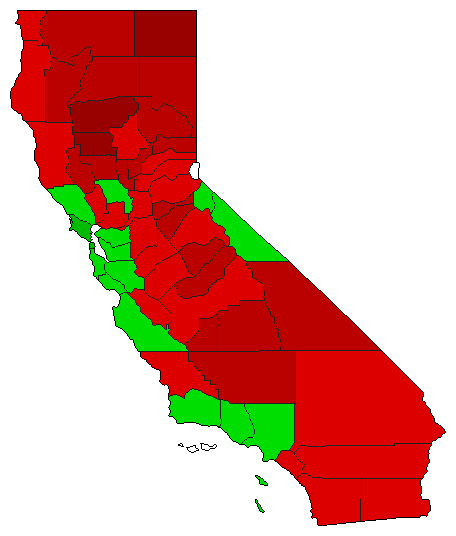
Initiative General Election Results Comparison - California
Note: The Google advertisement links below may advocate political positions that this site does not endorse.
MapPieYearTotalDRIMargin%MarginDemRepIndOth.DemRepIndOther 
                 
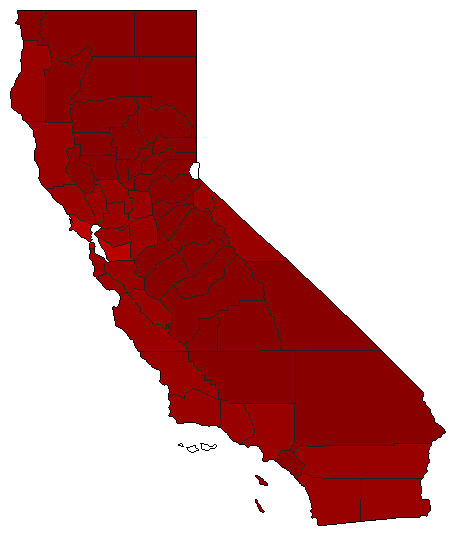
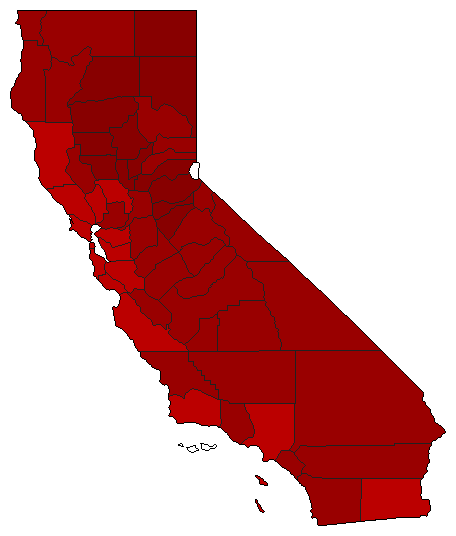
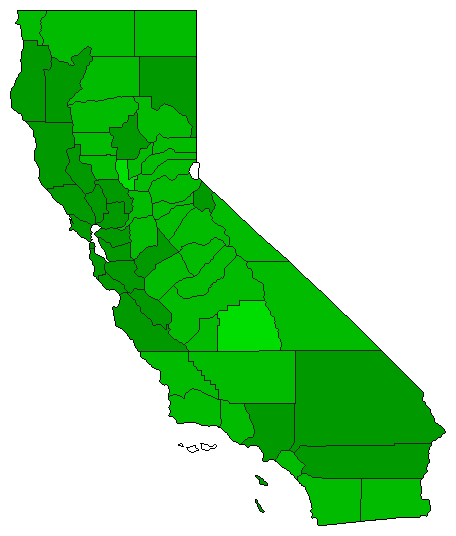
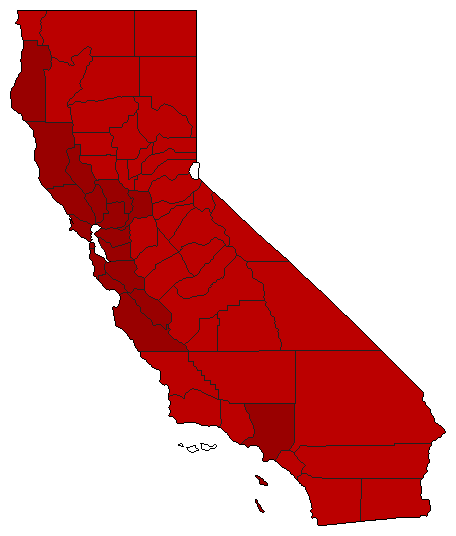
MapMap2020 16,690,056 2 0 1 2,079,194 12.46% 43.77% 0.00% 56.23% 0.00% 7,305,431 0 9,384,625 0
Map2006 8,344,268 1 0 2 4,449,644 53.33% 76.66% 0.00% 23.34% 0.00% 6,396,956 0 1,947,312 0
Map2004 11,408,941 1 0 2 4,922,677 43.15% 71.57% 0.00% 28.43% 0.00% 8,165,809 0 3,243,132 0
Map2002 4,742,857 2 0 1 2,040,499 43.02% 28.49% 0.00% 71.51% 0.00% 1,351,179 0 3,391,678 0
Map2000 10,523,230 1 0 2 4,320,844 41.06% 70.53% 0.00% 29.47% 0.00% 7,422,037 0 3,101,193 0
Map1998 8,008,134 2 0 1 80,118 1.00% 49.50% 0.00% 50.50% 0.00% 3,964,008 0 4,044,126 0

California Results for 2000

Login

Terms of Use - DCMA Policy - Privacy Policy and Cookies


© Dave Leip's Atlas of U.S. Elections, LLC 2019 All Rights Reserved